Public transport stops
The Public transport stops dataset provides information on the location of public transport stops and metro stations.
Usage scenarios
The Public transport stops dataset helps to solve different problems:
- Selecting a location for opening a business. It helps to calculate the number of public transport stops accessible from business locations and select a place with a high passenger flow.
- Geospatial analysis. You can aggregate data or build proximity zones. For example, calculate the number of residents living within a 5-minute or a 10-minute walk from a metro station, or build proximity zones from public transport stops to identify potential business locations.
How is the data collected?
The data is collected and regularly verified by Urbi specialists.
Data update and history
- Update frequency: data is updated once a week.
- History: historical data is not available. You can only view the latest updated data.
Available territories
Data is available for the following countries:
- Oman
- Qatar
- Saudi Arabia
- UAE
The data may not be available throughout the entire country, but only in populated areas where Urbi is present and where data on user trips is collected. To check data availability, use geofilters or contact the technical support.
Data availability
- On-Cloud (Urbi Pro service): data is available upon request and is not available in the demo tariff. To start working with the data, change the tariff and request access to the dataset.
- On-Premise (installation of the service in a private environment): data is available.
Getting started
-
Go to the Main or Data tab.
-
Select the Public transport stops dataset.
-
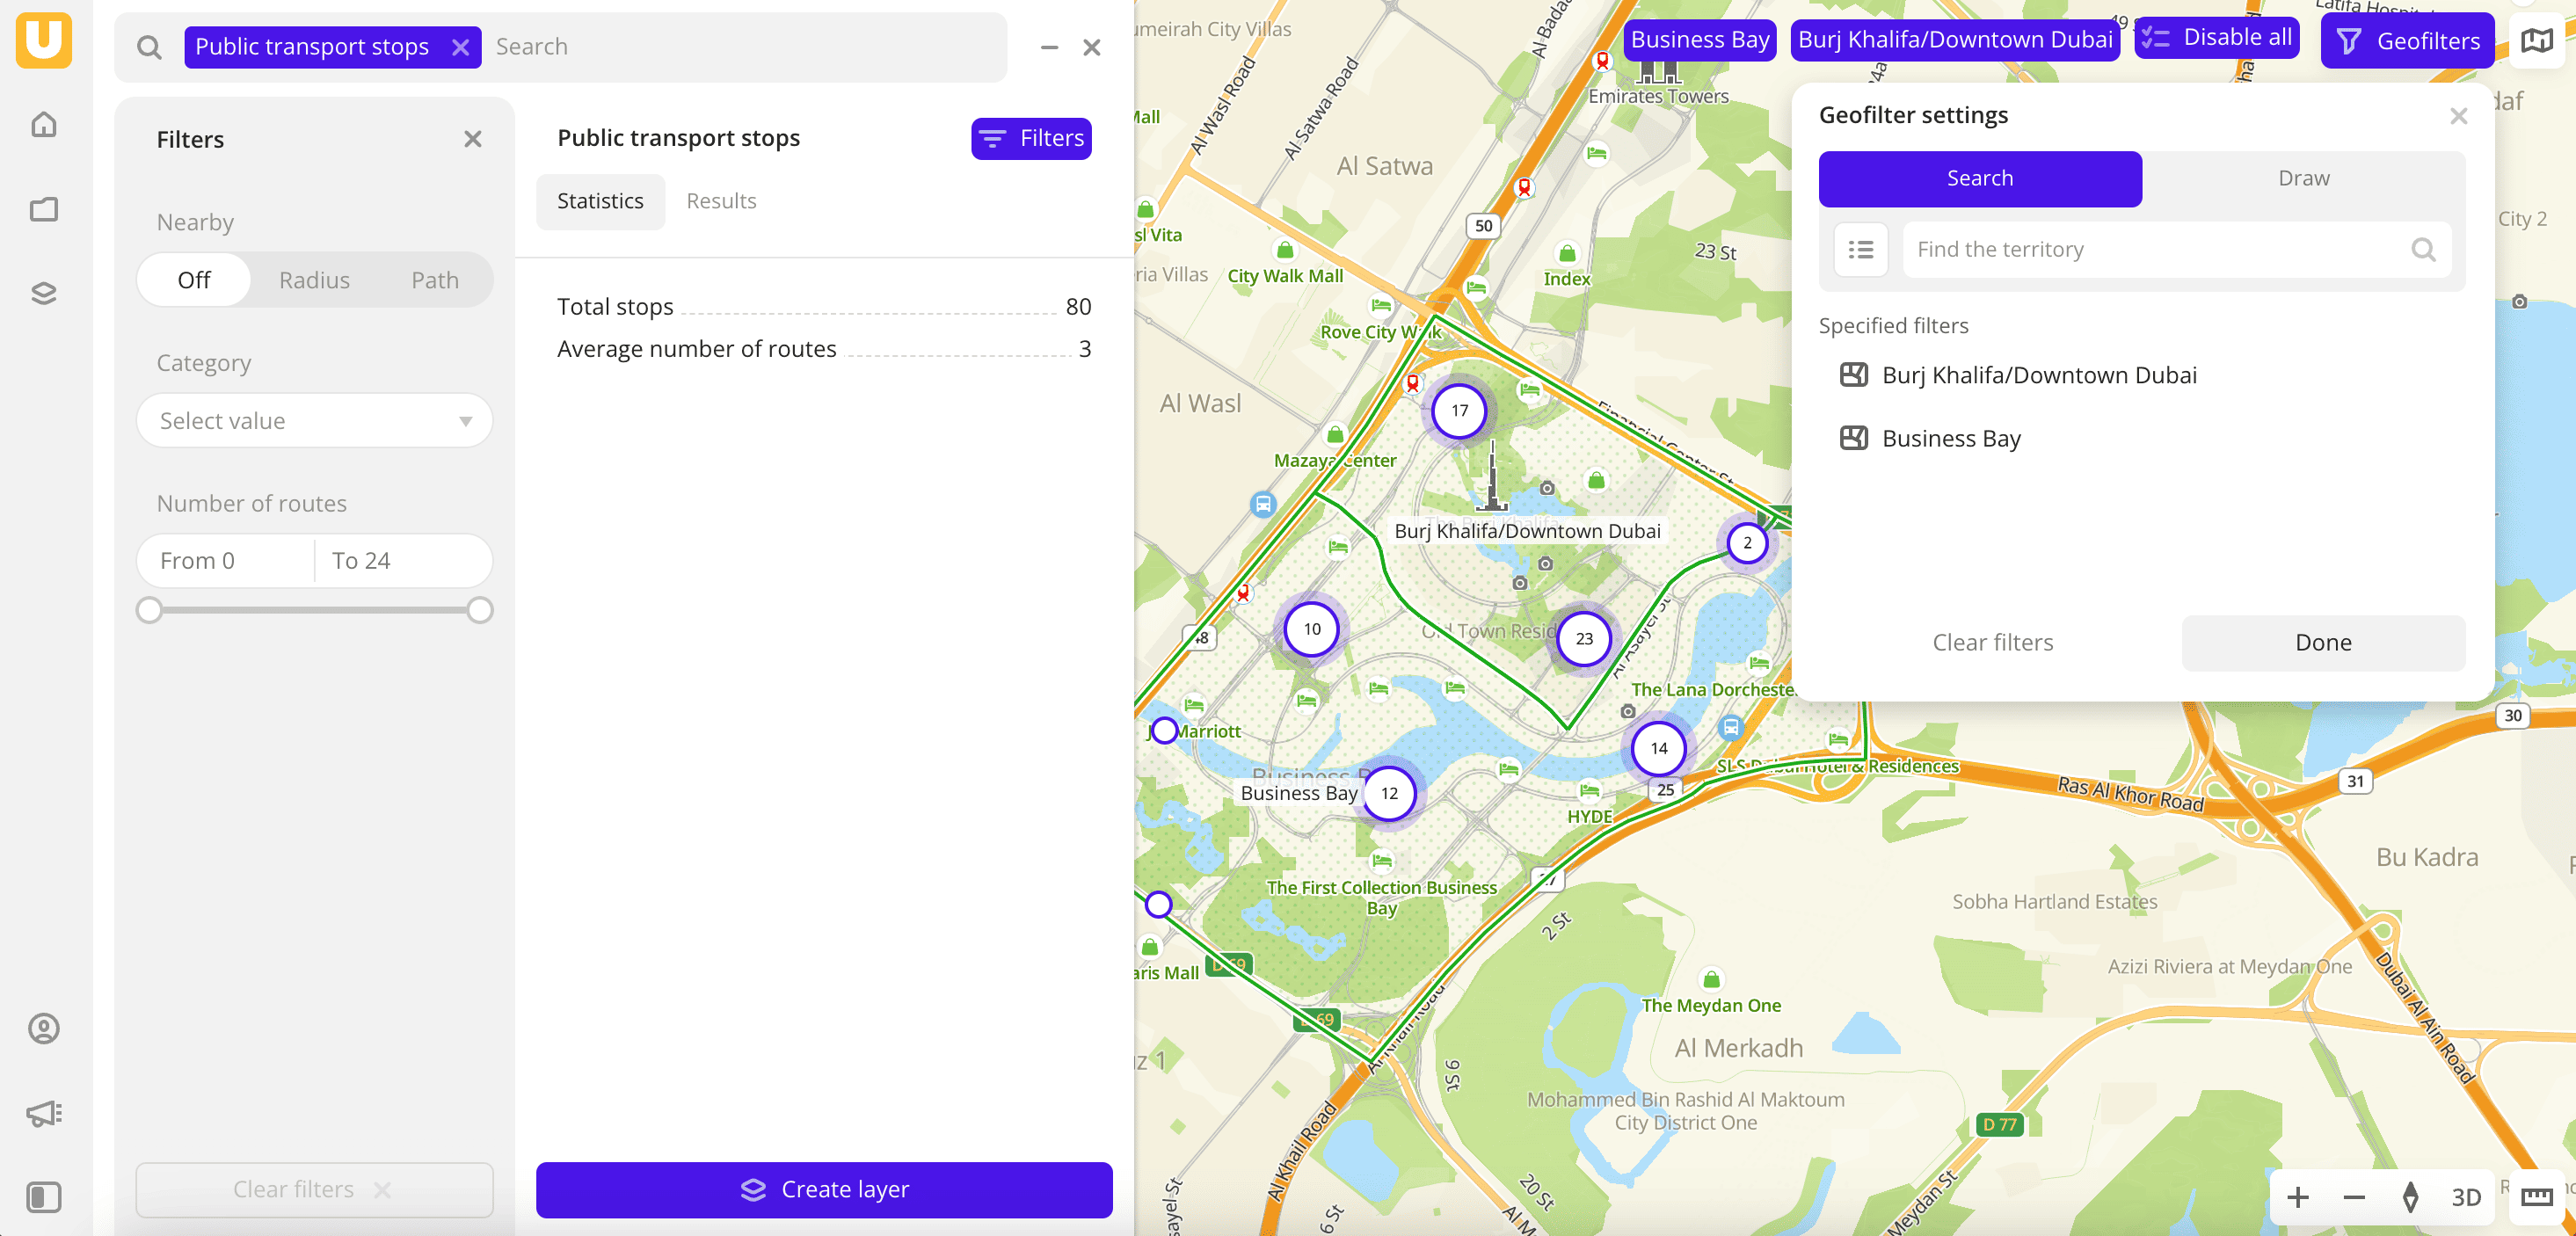
In the Geofilter settings dialog, select up to 50 territories for which the data sample is created. You can use standard and custom territories and also build polygons, proximity zones, and circles on the map. For more information, see the Geofilters section. After you select the territories, click Done.
-
On the Filters tab, select basic filters for data analysis:
- To view data about stops, select the Category → Stations filter.
- To view data about metro stations, select the Category → Metro stations filter.
-
Set the remaining filters if necessary.
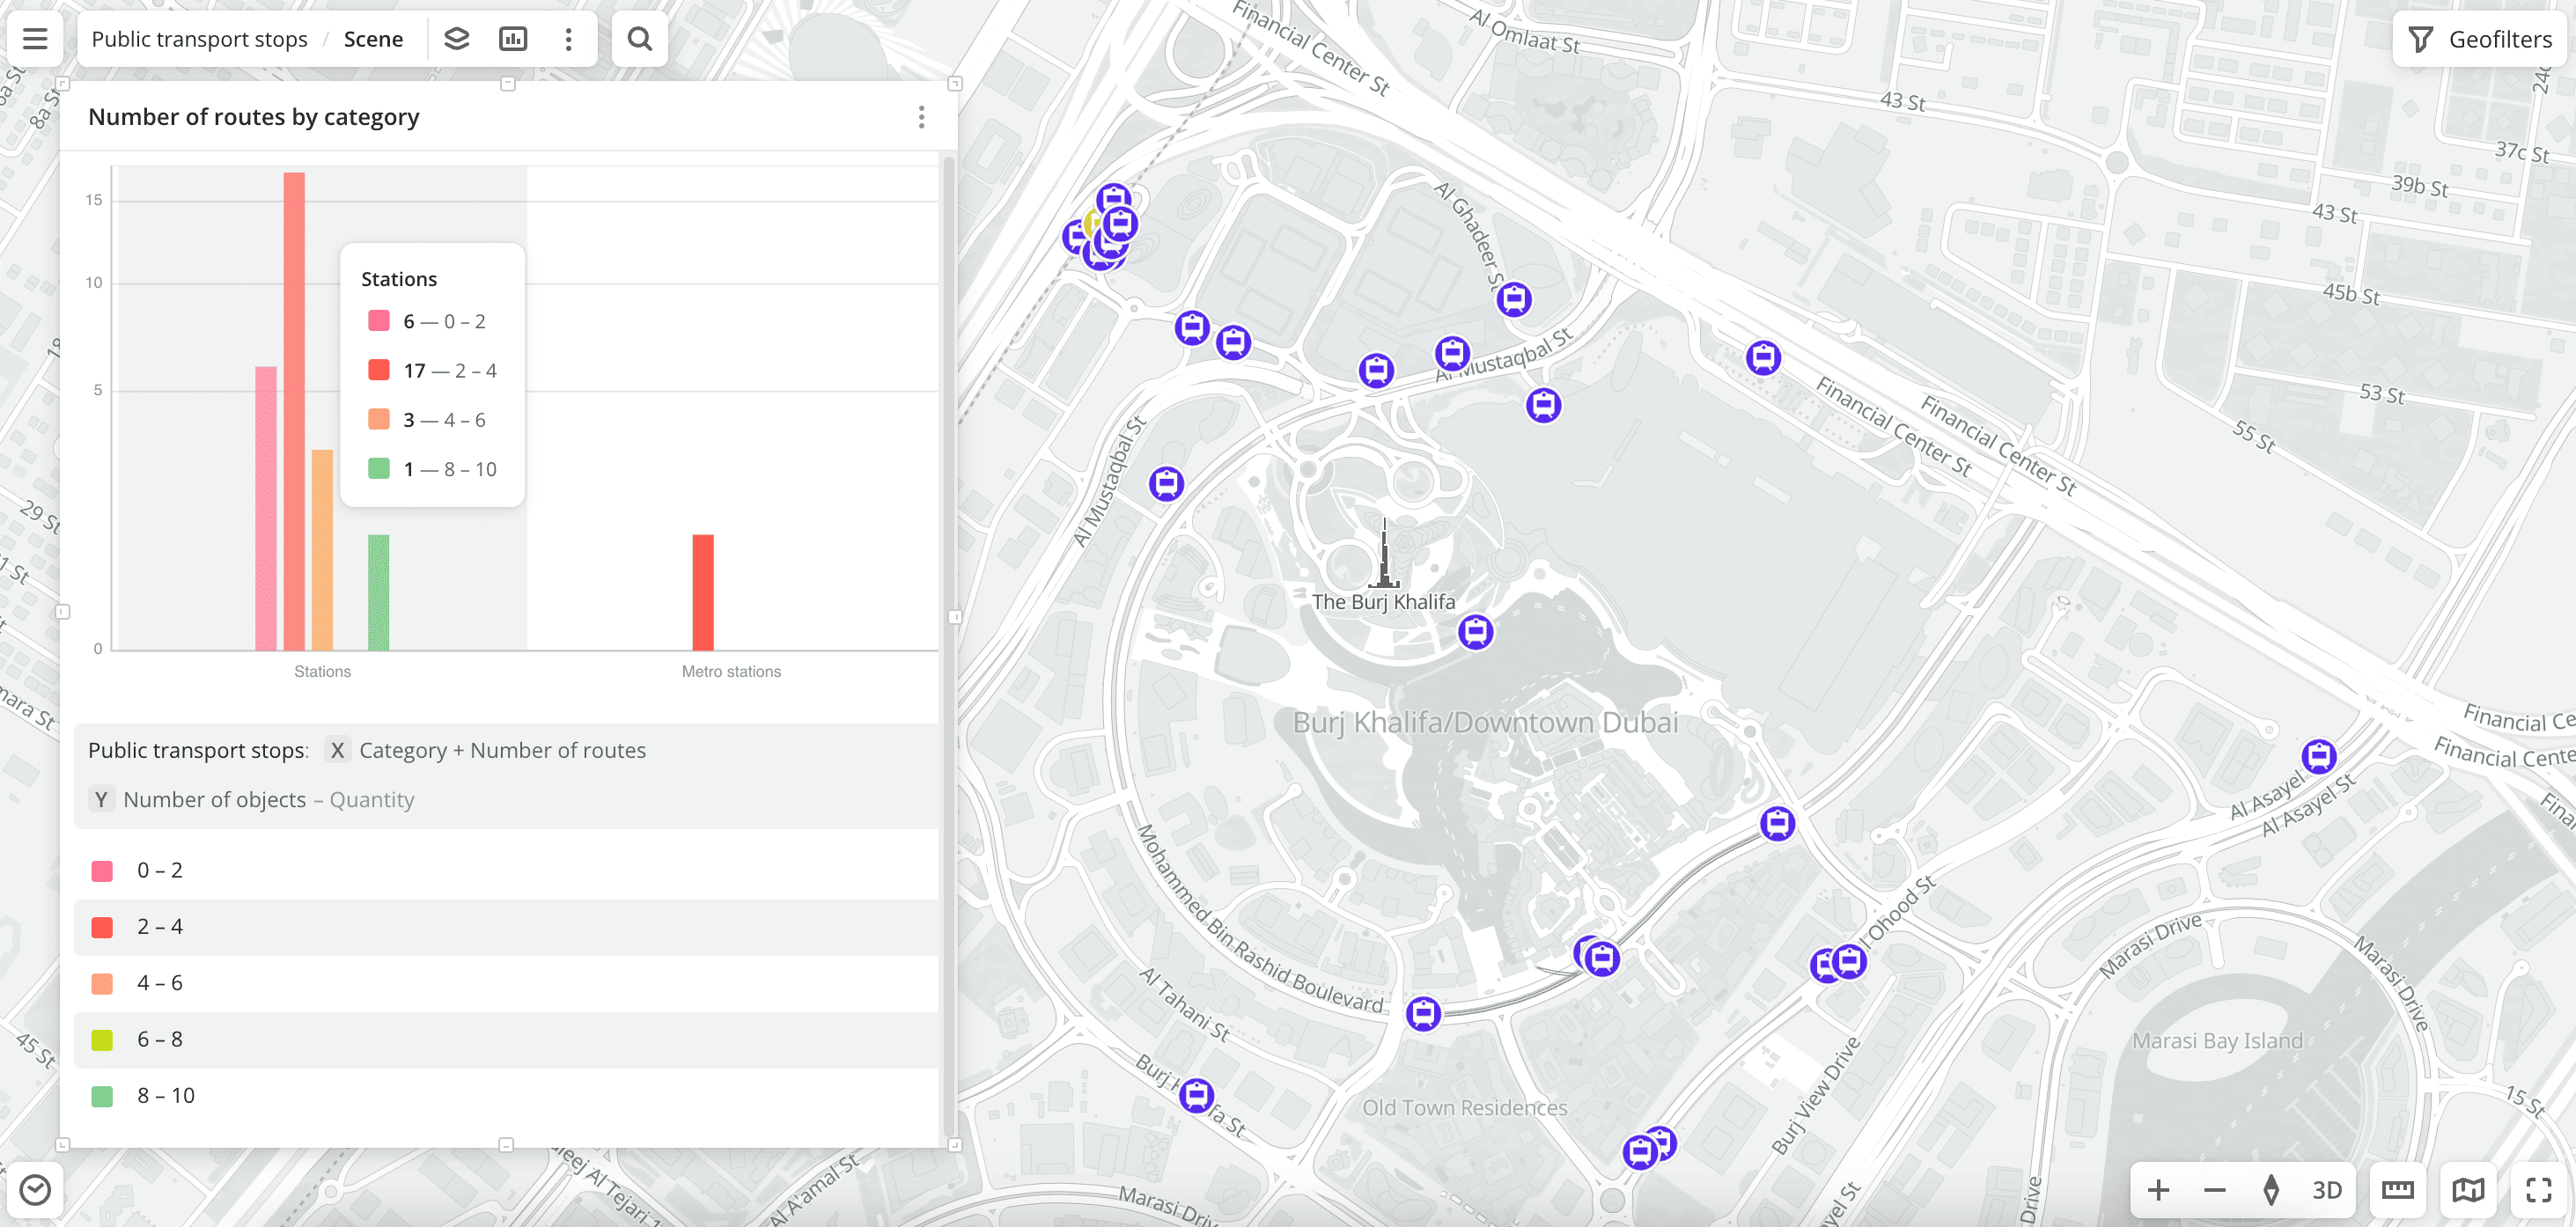
The data is displayed on the map as points. Filtering results are available on two tabs:
-
Statistics: general statistics about the sample:
- Total count of stops.
- Average count of routes passing through stops.
-
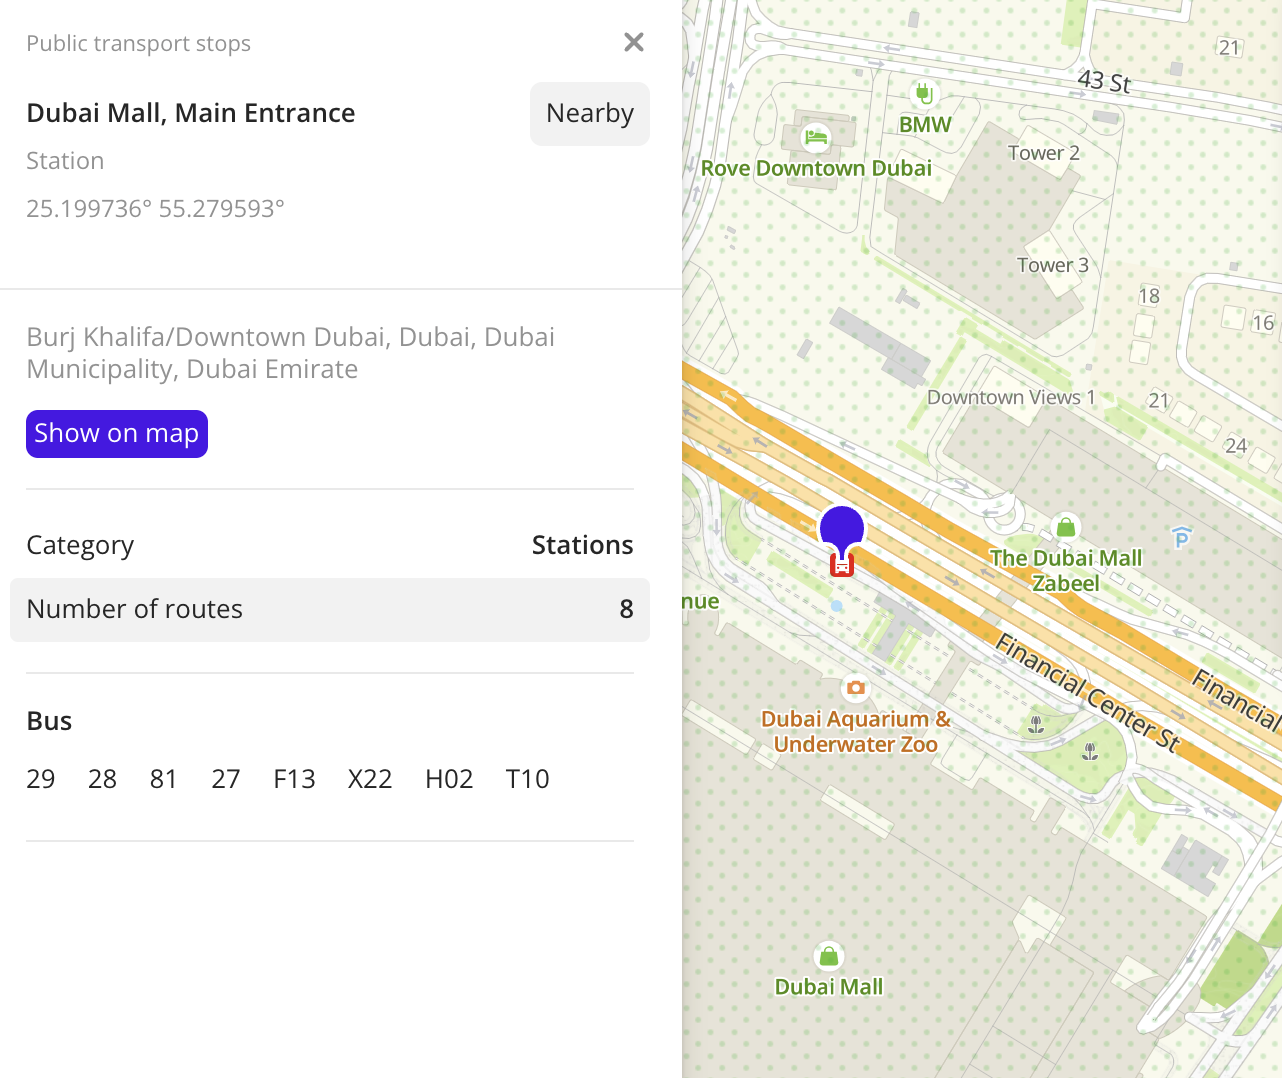
Results: general information about stops and their list. When selecting a stop from the list:
- Information about the stop is displayed in the card, including the count of routes passing through the stop, types of transport, and their routes.
- The location of the stop is indicated on the map.
You can manually change the list of filtering results to keep only selected stops in the data sample. Click Edit list, select the required stops, and click Apply.
To save the data sample, click Create layer and customize data visualization.
Filters
For the Public transport stops dataset, the following filters are available:
-
Category:
-
Stations: location of stop (boarding) platforms on the map: places where you can board the public transport. For metro stations, the locations of entrances and exits are displayed.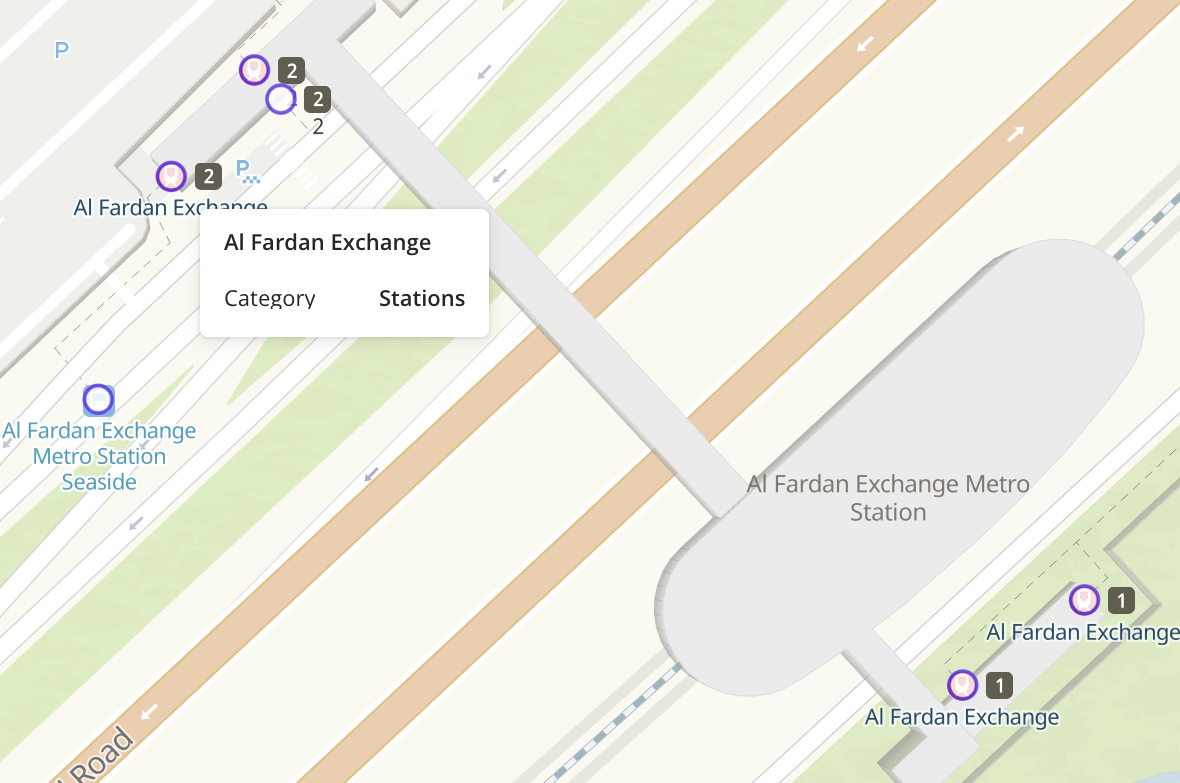
-
Metro stations: for each metro station, only one point is displayed on the map.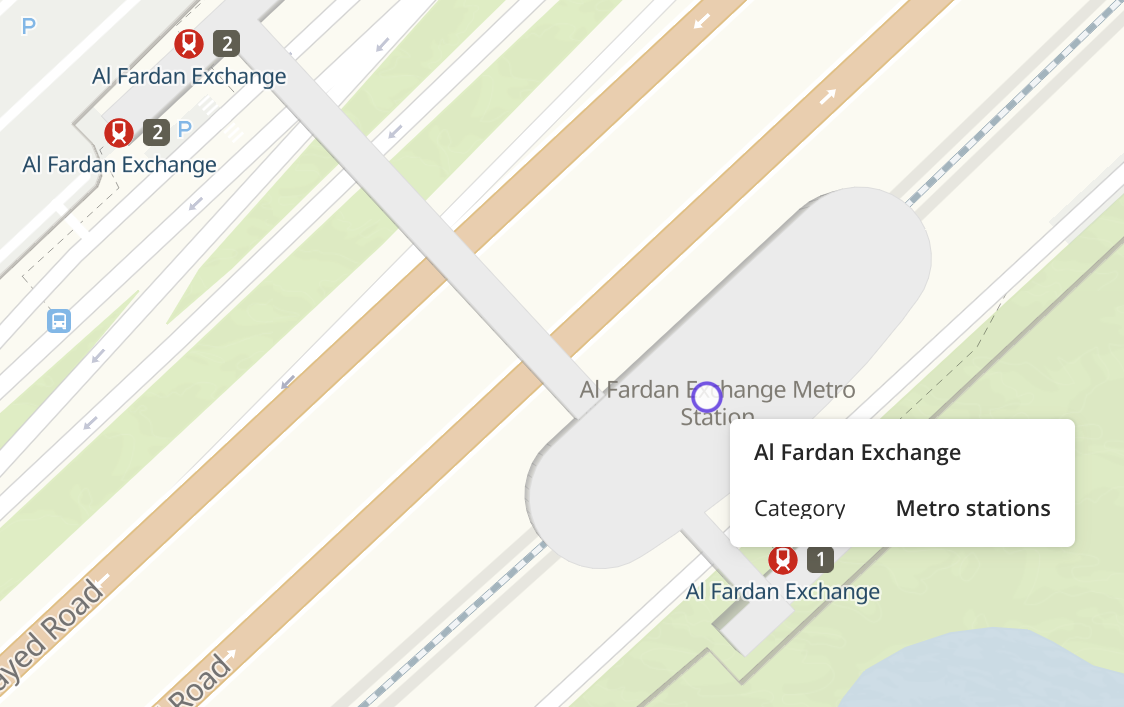
-
-
Number of routes: total count of routes passing through a public transport stop or a metro station.
-
Transport group:
Ground transport: stops for ground transport.Metro: entrances and exits of metro stations.Rail transport: suburban railway stations.
Available only for the
Stationscategory. -
Type of transport:
Bus,Tram,Metro,Monorail, orWater Transport.Available only for the
Stationscategory.
To reset the parameter filter, click ![]() icon next to the filter name. To reset all parameter filters, click Reset filters at the bottom of the tab.
icon next to the filter name. To reset all parameter filters, click Reset filters at the bottom of the tab.
To hide the filter by territory, in the Geofilter settings dialog, click ![]() icon next to the geofilter name. To delete the geofilter, click
icon next to the geofilter name. To delete the geofilter, click ![]() icon next to its name. To delete all geofilters, click Clear filters.
icon next to its name. To delete all geofilters, click Clear filters.
Data visualization
The following visualization methods are available for the dataset:
After creating the layer, configure a basic data visualization:
-
Select the Point visualization method:
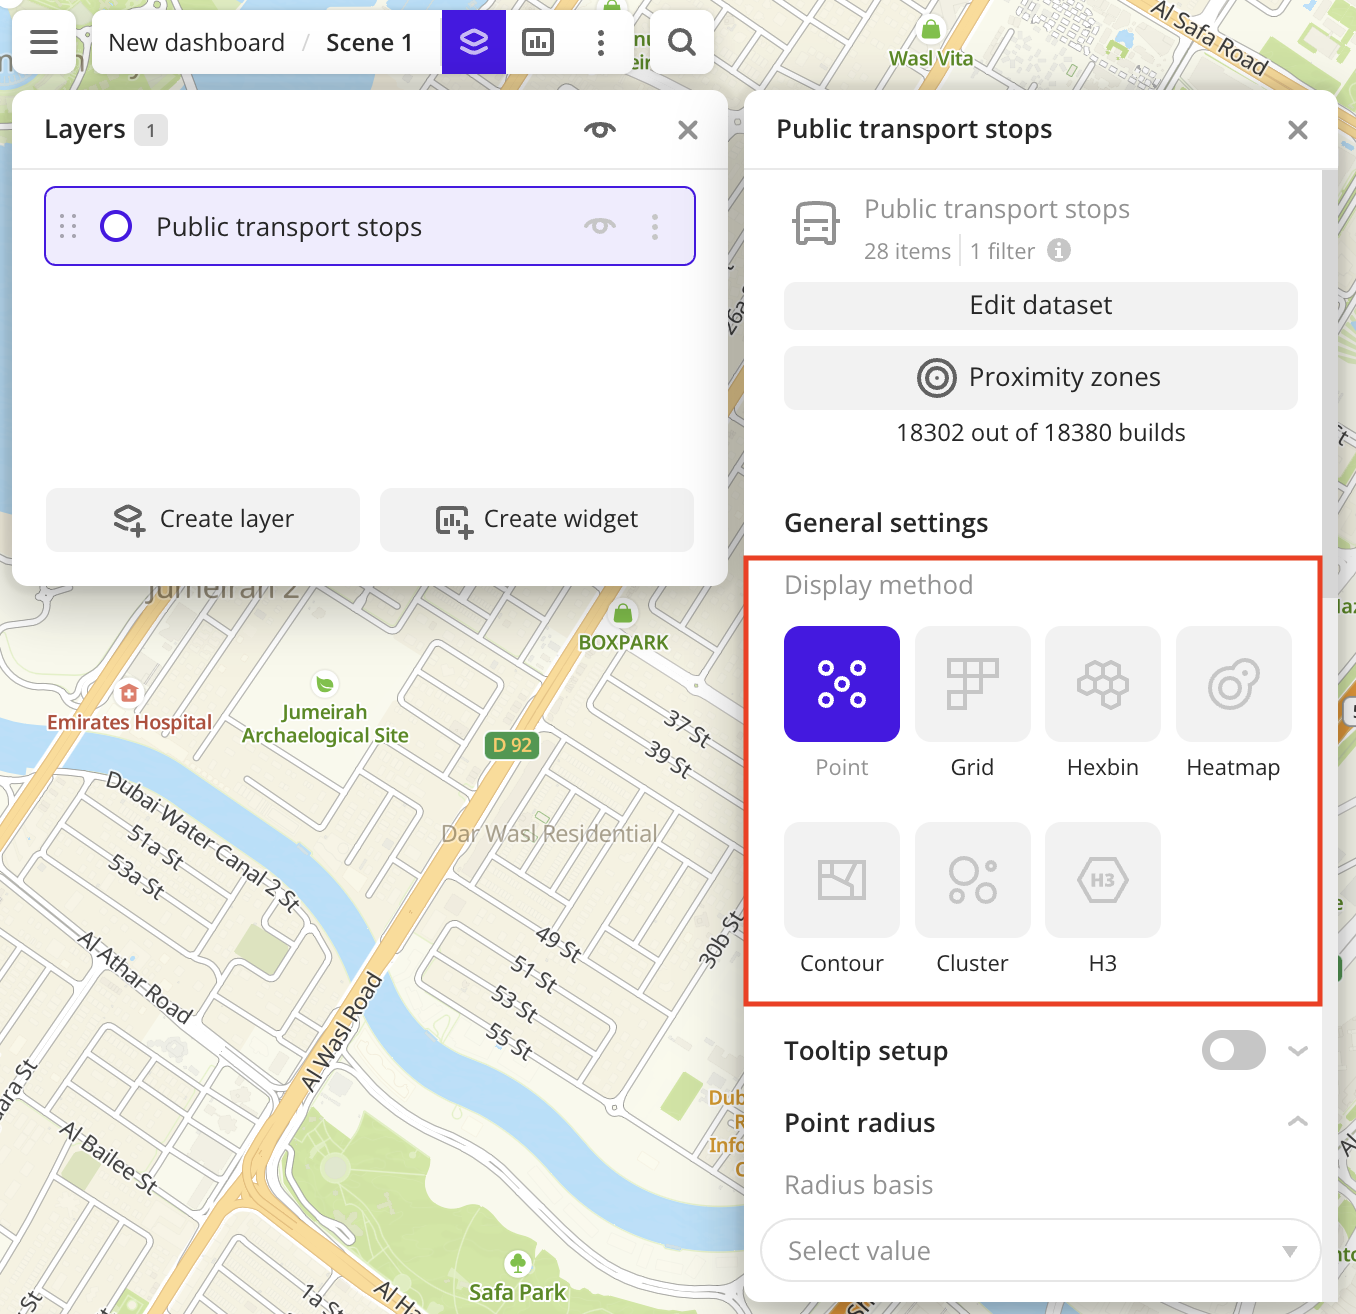
-
To configure a tooltip, enable the Tooltip setup option and select the basic data attributes:
CategoryandNumber of routes: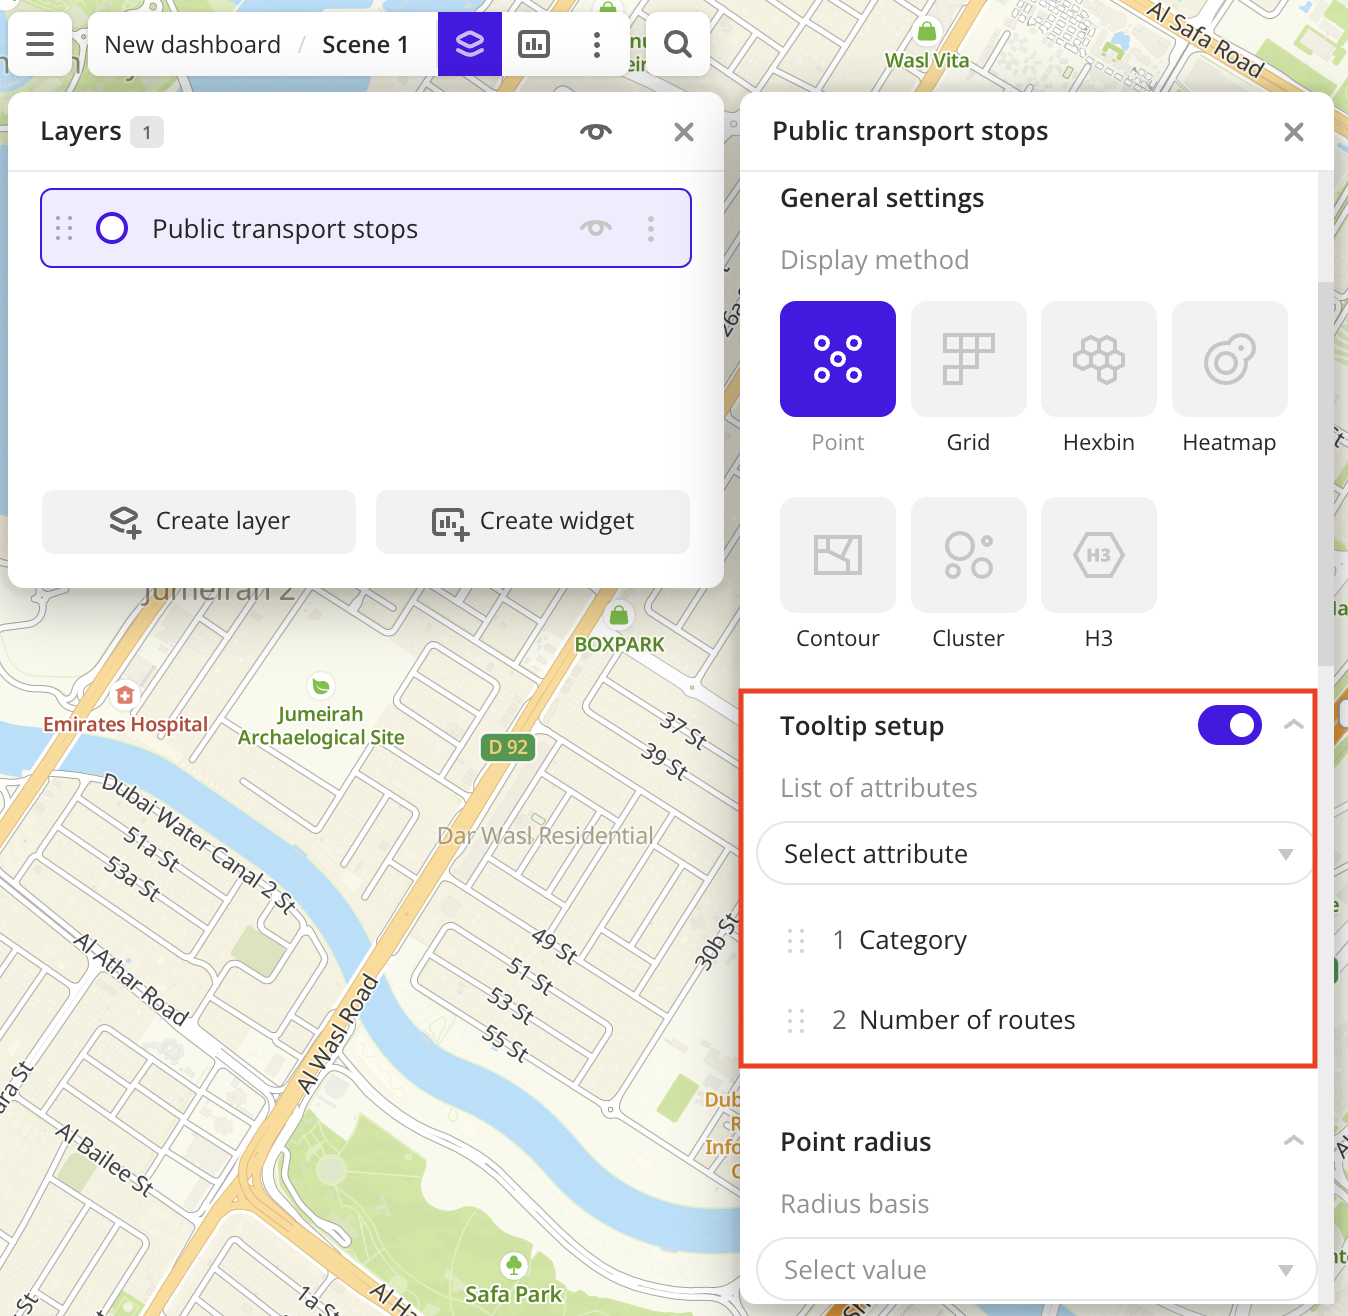
-
In the Icon field, select the required icon to display points on the map:
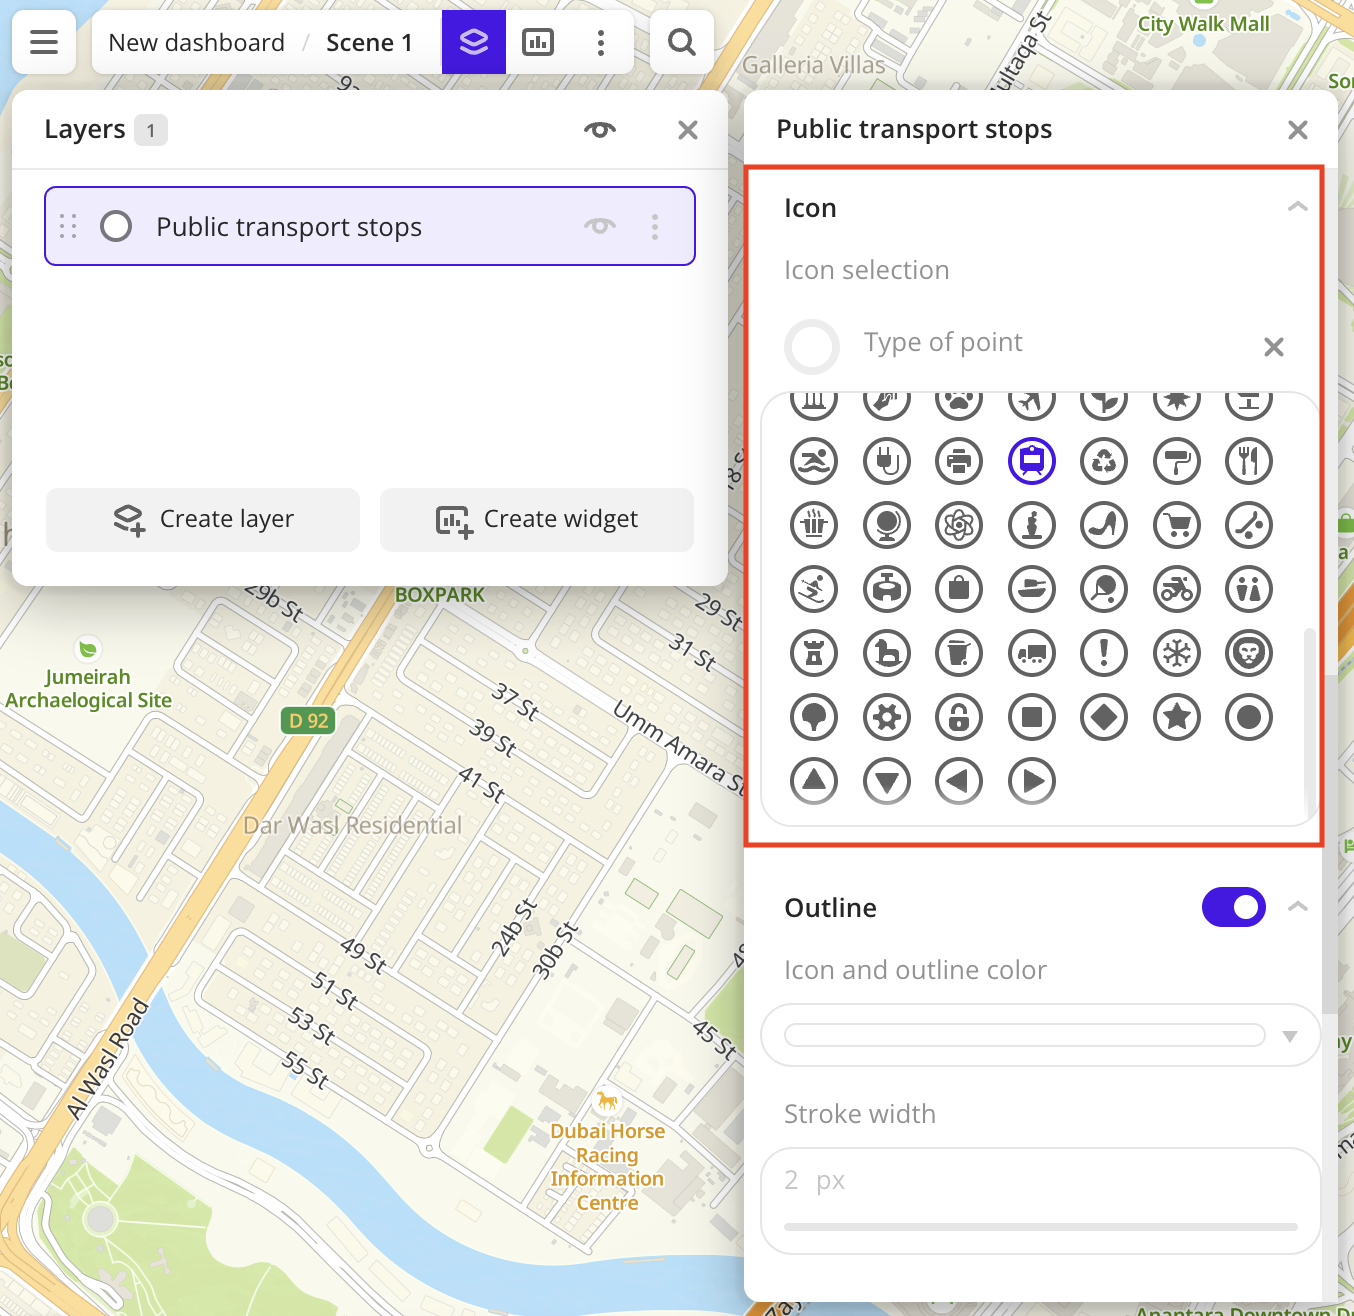
-
To analyze stop locations, change the color of the points on the map depending on the stop category. In the Color basis field, select the
Categoryattribute and specify the color scale: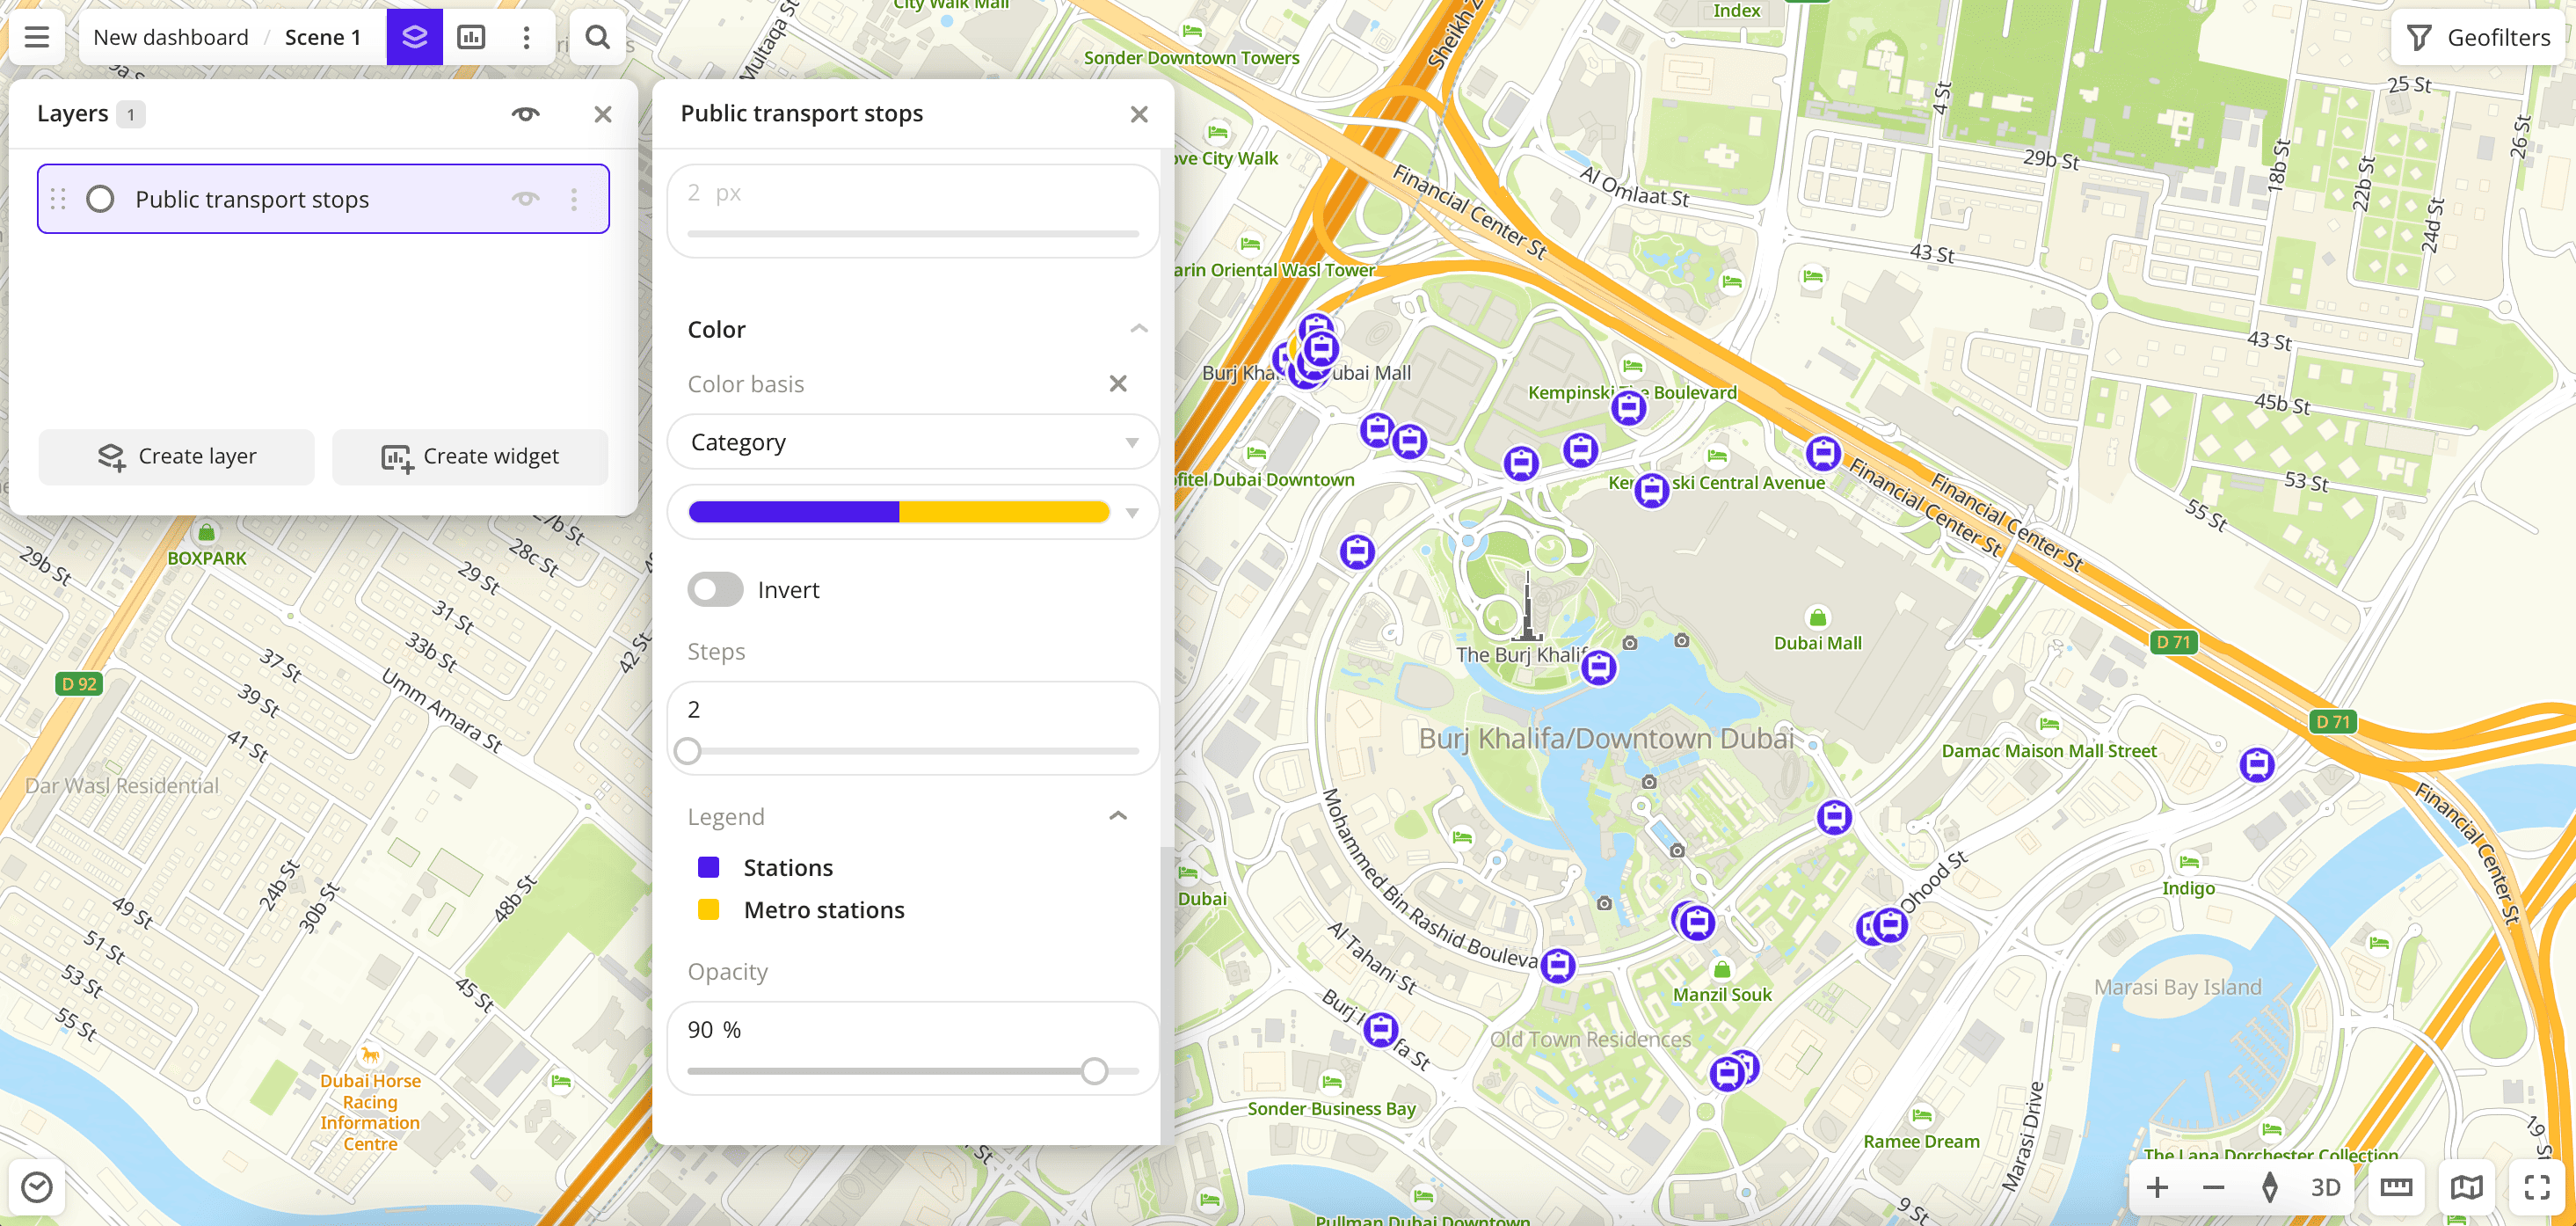
Data purchasing
You can purchase data separately as an export in the following formats:
- Table formats:
.csv.txt.json
- Formats for storing geographic data:
.shp(Shape).gpkg(GeoPackage).geojson(GeoJSON)
For more information about the price, available territories, and how to purchase data, fill out the form on urbi.ae.
What's next?
- Quick start.
- Get to know more about other Data categories.
- Get to know how to work with Data visualization.
- Get to know more about Layers, Dashboards, Scenes, and Widgets.
- Get to know prepared Analytics presets.