Demand
The Demand dataset provides information about search queries with selected filters.
Usage scenarios
The Demand dataset helps to solve different problems:
- Selecting a location with high demand to open a business. It helps to identify areas with consistently high user interest in a specific category (for example, "cafe", "laundry", or "fitness").
- Analyzing unmet demand. It allows you to compare the demand map with the actual number of operating companies (see the Firms dataset) and find "blank spots": areas with many requests but no supply. This is especially useful for rapid scaling of chain businesses.
- Testing service popularity before launch. It helps to analyze the level and geography of user interest in a niche before the actual launch of a product or franchise. For example, whether the interest in services like "electric scooter charging" or "local bakery" is growing or not.
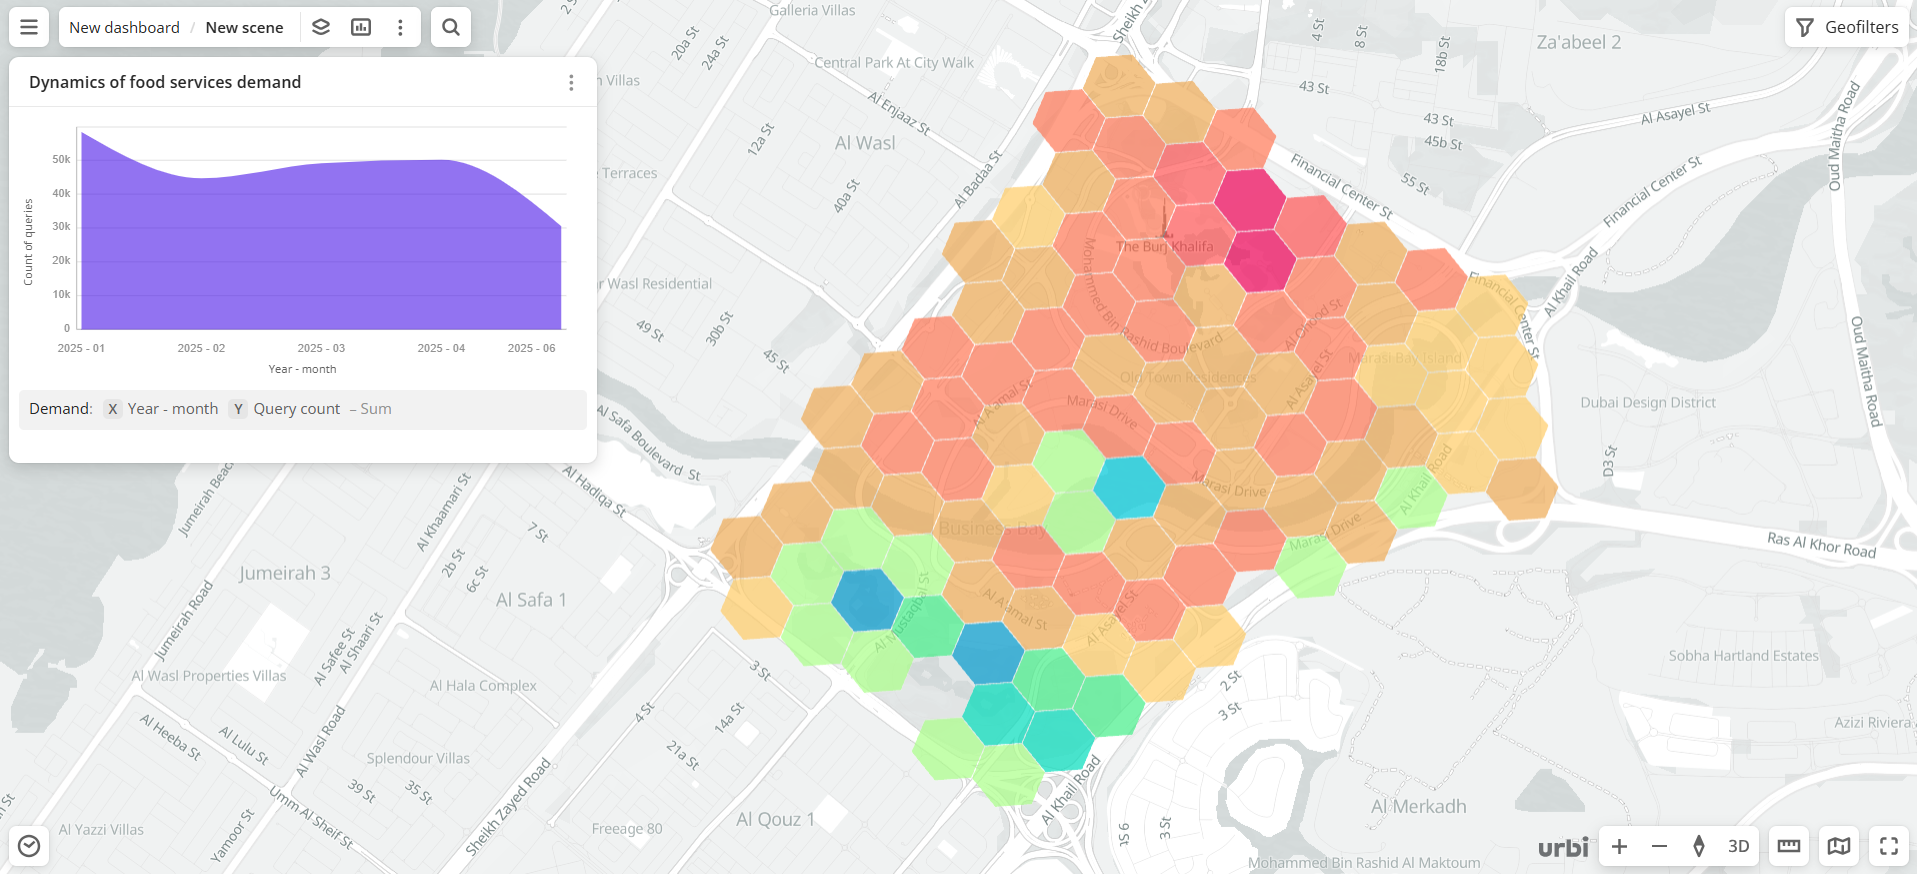
- Analyzing seasonality and temporal demand trends. It enables tracking the dynamics of interest in specific categories by months and adapting offerings. For example, peak interest in the "motorcycle services" category is observed in spring, "electric scooters" in summer, and "beauty salons" before New Year.
How is the data collected?
The demand map represents aggregated data about user queries in Urbi. A query is counted when a user opens a company card at a specific time and location: for example, a user opens the card of company X (in the "cafe" category) in the app on 2024-06-30 at 11:30, while being at the point with coordinates 55.75, 37.61. All such queries are aggregated over the following month and become available in Urbi Pro as H3 cells (hexagons).
Data update and history
- Update frequency: data is updated once a month.
- History: historical data for the last 18 months is available.
Available territories
Data is available for the following countries:
- Bahrain
- Kuwait
- Oman
- Qatar
- Saudi Arabia
- UAE
The data may not be available throughout the entire country, but only in populated areas where Urbi is present. To check data availability, use geofilters or contact the technical support.
Data availability
- On-Cloud (Urbi Pro service): data is available upon request and is not available in the demo tariff. To start working with the data, change the tariff and request access to the dataset.
- On-Premise (installation of the service in a private environment): data is not available.
Getting started
To get started:
- Go to the Main or Data tab.
- Select the Demand dataset.
- In the Geofilter settings dialog, select up to 50 territories for which the data sample is created. You can use standard and custom territories and also build polygons, proximity zones, and circles on the map. For more information, see the Geofilters section. After you select the territories, click Done.
- On the Filters tab, set the remaining filters if necessary.
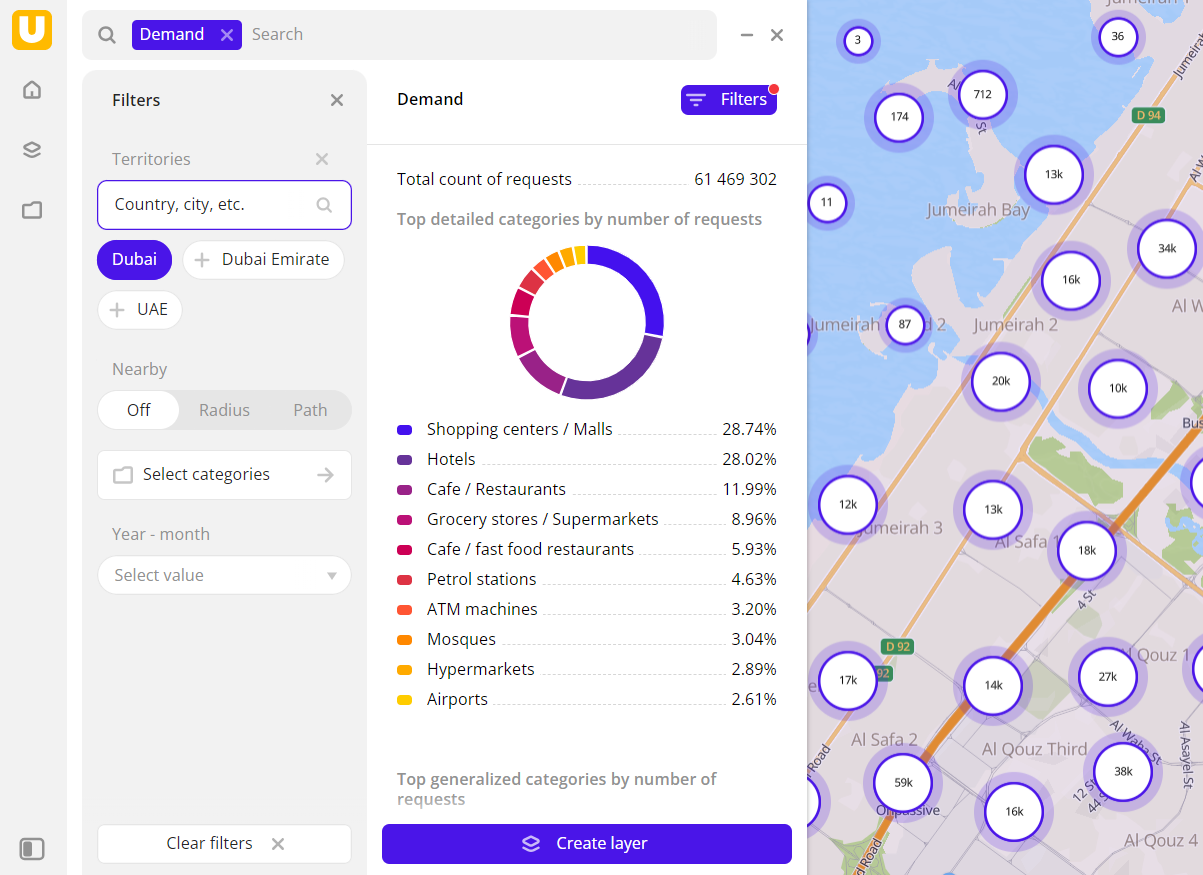
The data is displayed on the map as centroid points: the centers of the object geometries. The following filtering results are available:
- Total count of requests.
- Chart with the distribution of requests by subcategories. Displayed if multiple organization subcategories are selected.
- Chart with the distribution of requests by generalized categories. Displayed if multiple subcategories from different categories are selected.
- Count of requests by the hour.
To save this data sample and customize its visualization (e.g., as a heatmap), click Create layer.
Filters
For the Demand category, the following filters are available:
-
Select categories: categories of organizations in the directory. More than 1500 subcategories are also available (e.g., category
Food servicecontains thePastry shopssubcategory).You can select multiple categories and subcategories. Click Select categories, select categories from the list, and click Apply.
If an organization has multiple subcategories (e.g., Food court and Coffee shop), it displays in the filtering results even if the filter only by one subcategory is applied (e.g., Coffee shop).
-
Year-month: year and month to display data. You can select multiple options.
-
Query count: count of user queries.
To reset the parameter filter, click ![]() icon next to the filter name. To reset all parameter filters, click Reset filters at the bottom of the tab.
icon next to the filter name. To reset all parameter filters, click Reset filters at the bottom of the tab.
To hide the filter by territory, in the Geofilter settings dialog, click ![]() icon next to the geofilter name. To delete the geofilter, click
icon next to the geofilter name. To delete the geofilter, click ![]() icon next to its name. To delete all geofilters, click Clear filters.
icon next to its name. To delete all geofilters, click Clear filters.
Data visualization
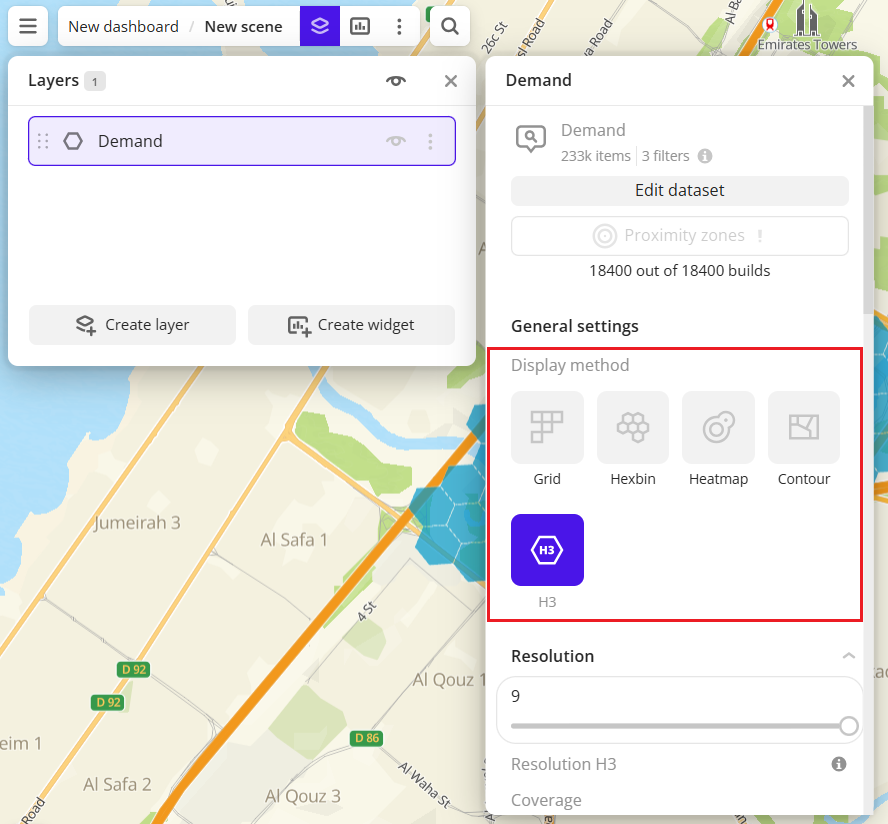
The following visualization methods are available for the dataset:
After creating the layer, configure a basic data visualization:
-
Select the H3 visualization method:
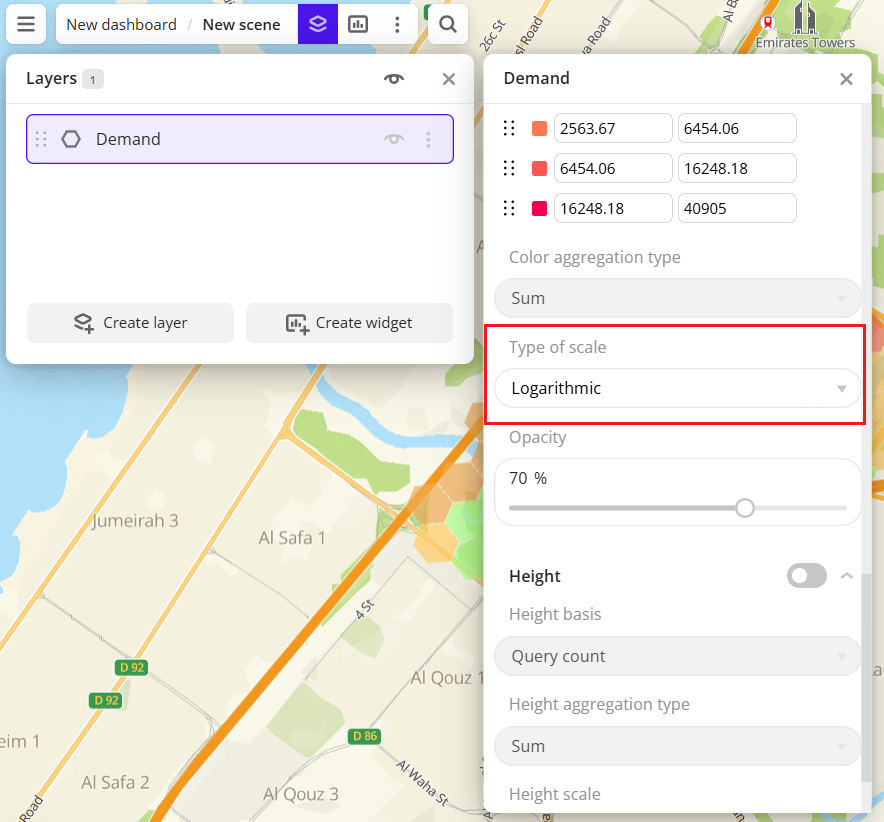
-
In the Type of scale field, select Logarithmic:
Data purchasing
You can purchase data separately as an export in the following formats:
- Table formats:
.csv.txt.json
- Formats for storing geographic data:
.shp(Shape).gpkg(GeoPackage).geojson(GeoJSON)
For more information about the price, available territories, and how to purchase data, fill out the form on urbi.ae.
What's next?
- Quick start.
- Get to know more about other Data categories.
- Get to know how to work with Data visualization.
- Get to know more about Layers, Dashboards, Scenes, and Widgets.
- Get to know prepared Analytics presets.