Population
The Population dataset provides information about living and working population.
Usage scenarios
The Population dataset helps to solve different problems:
- Assessment of potential demand for goods and services. It allows businesses (stores, pharmacies, and others) to estimate the potential number of customers based on data about the living and working population in specific buildings or neighborhoods.
- Choosing a location for opening a retail outlet. It helps to identify areas with high density of living or working population to ensure a steady flow of customers throughout the day or at specific times.
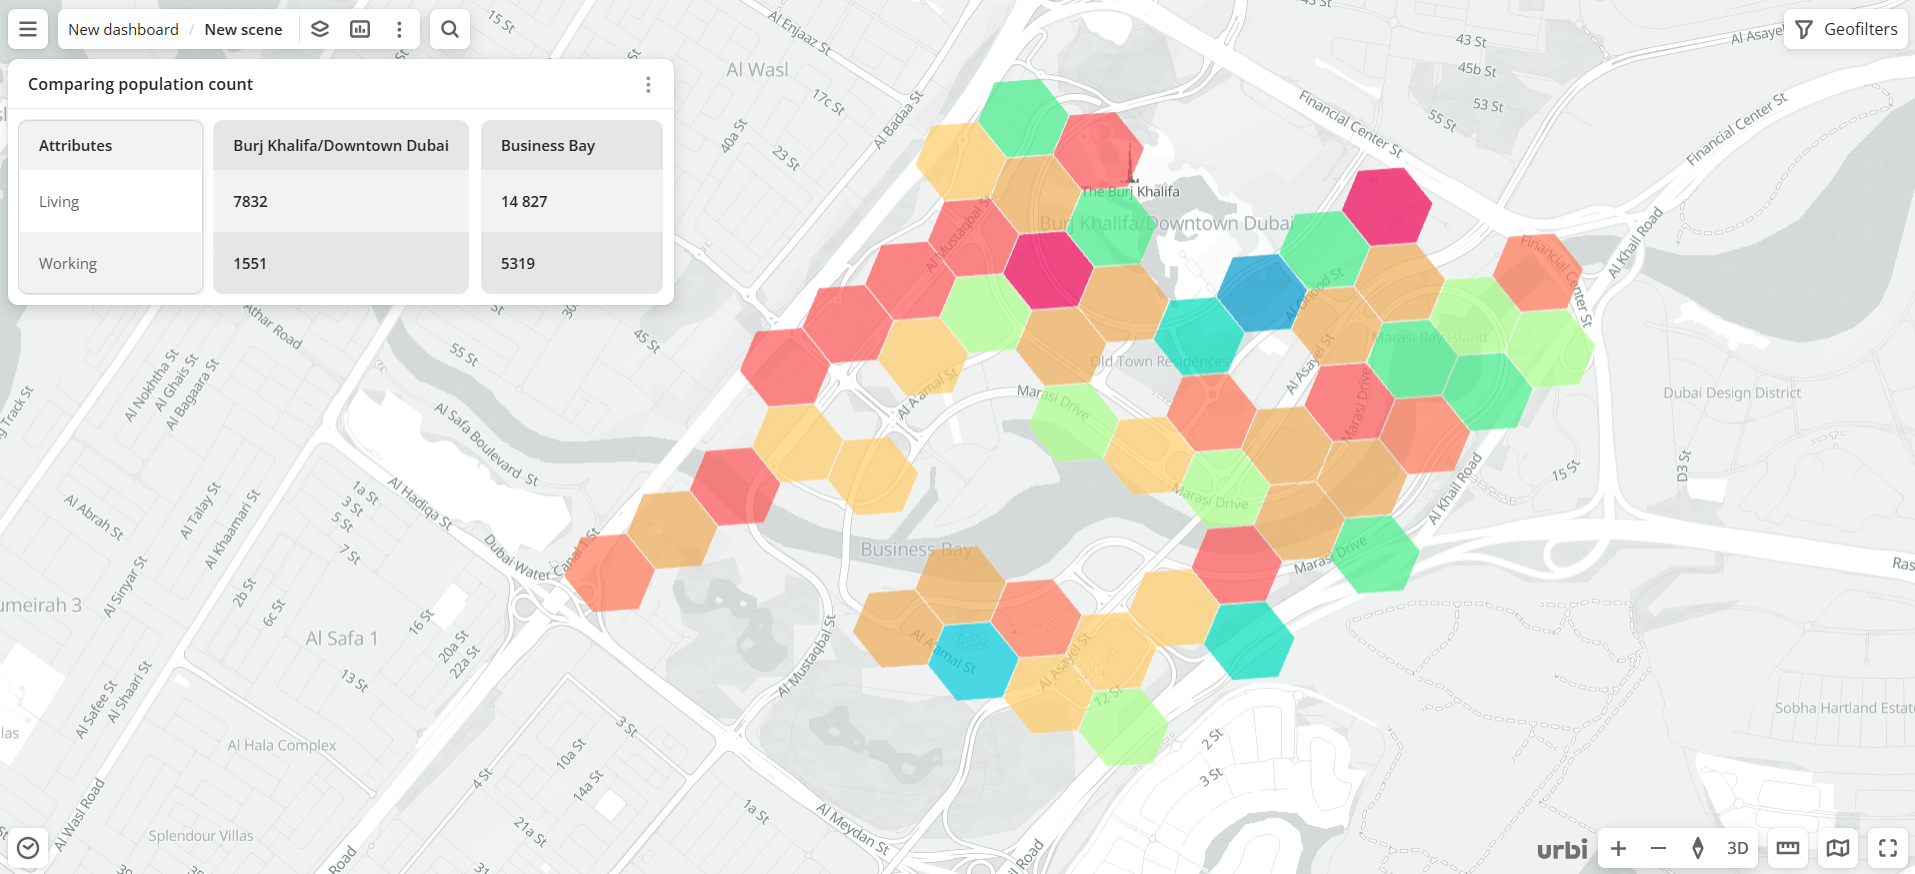
- Analysis of the "live-work" ratio for planning offerings. It helps to determine the appropriate type of business for a specific area. For example, in areas with high "daytime migration" (many employees, few residents), it is more profitable to open lunch and quick-service options, while in residential neighborhoods, family-oriented services and leisure activities are more suitable.
- Optimization of advertising and marketing strategies. It enables more precise targeting in marketing campaigns. For example, in office zones, advertise business services, lunch offers, and coffee-to-go, while in residential areas, focus on everyday goods, pharmacies, and family-oriented services.
How is the data collected?
Living population
The algorithm for calculating the living population contains the following steps:
-
Estimating residential area.
The amount of residential space in each building is determined based on its type:
- Apartment building: data on the number of apartments or total area is used.
- Private house: counted as a single household, total area is not considered.
-
Calculating the base number of residents.
Official housing standards (for example, the average number of people per apartment or per square meter) are applied to the residential area data (step 1). Information on these standards is available in open government sources.
-
Comparing the result with official statistics.
The calculated number of residents is compared with the official total population for the district or city. In case of discrepancies, the result is adjusted to more accurately reflect the real situation and to consider factors such as newly built but unoccupied buildings.
Working population
The algorithm for calculating the working population in a building contains the following steps:
-
Determining the type and size of business.
Data about the organizations in the building and their field of activity (for example, "restaurant" or "office") is collected, and the area they occupy is estimated. If a branch does not involve staff working on site (for example, a self-service ATM), it is excluded from the analysis.
-
Calculating the base number of employees.
If the number of employees in an organization is known, this data is used. If not, an average value typical for similar organizations in the same field is used.
-
Logical validation.
The result is checked for logical consistency and anomalous values are corrected: for example, if too little or too much area is assigned for one employee. This allows for the most realistic estimate of the working population in each building.
Data update and history
- Update frequency: data is updated once a month.
- History: historical data is not available. You can only view the latest updated data.
Available territories
Data is available for the following countries:
- Bahrain
- Kuwait
- Oman
- Qatar
- Saudi Arabia
- UAE
The data may not be available throughout the entire country, but only in populated areas where Urbi is present. To check data availability, use geofilters or contact the technical support.
Data availability
- On-Cloud (Urbi Pro service): data is available upon request and is not available in the demo tariff. To start working with the data, change the tariff and request access to the dataset.
- On-Premise (installation of the service in a private environment): data is available.
Getting started
- Go to the Main or Data tab.
- Select the Population dataset.
- In the Geofilter settings dialog, select up to 50 territories for which the data sample is created. You can use standard and custom territories and also build polygons, proximity zones, and circles on the map. For more information, see the Geofilters section. After you select the territories, click Done.
- On the Filters tab, set the remaining filters if necessary.
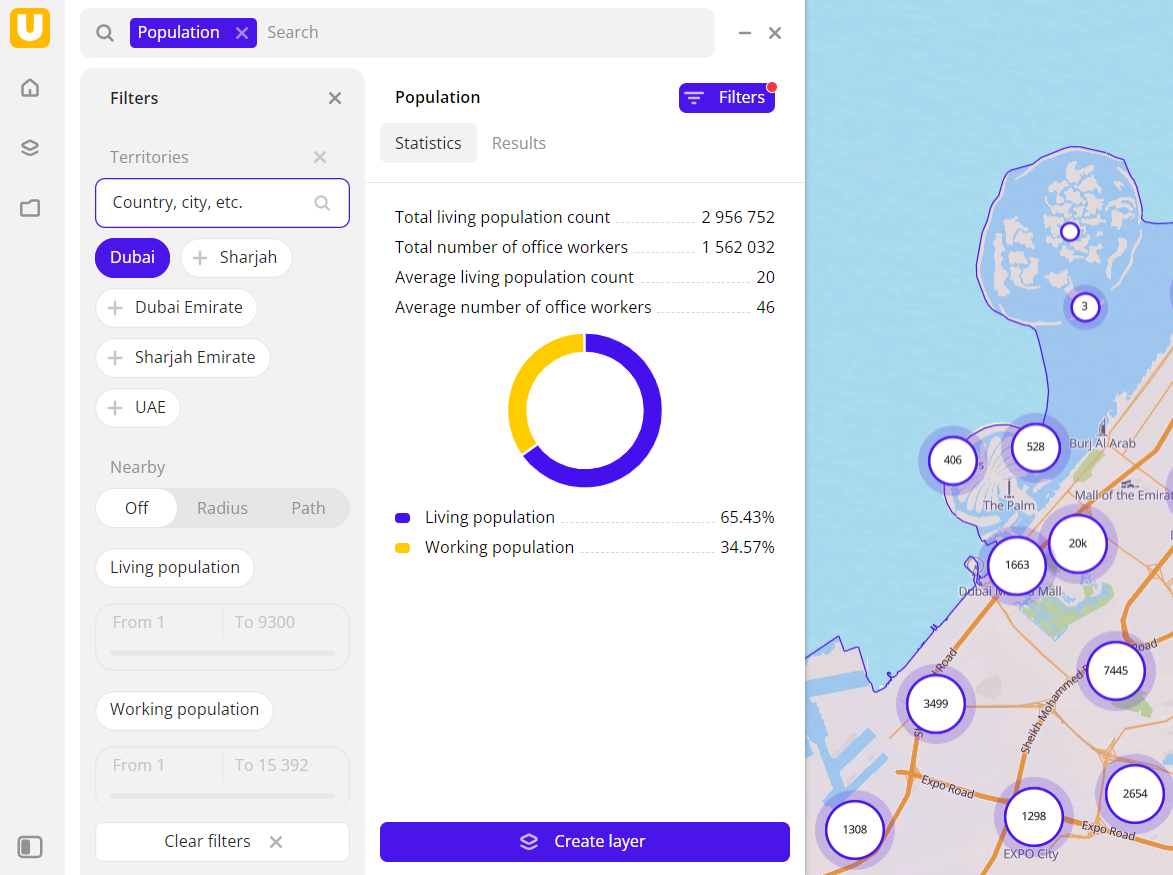
The data is displayed on the map as centroid points: the centers of the object geometries. Filtering results are available on two tabs:
-
Statistics: general statistics about the sample:
- Total and average count of the living population.
- Total and average count of working population.
- Chart with the distribution of population. Displayed if both categories are selected.
-
Results: general information about the population and a list of buildings in which the population lives and works. When selecting a building from the list:
- Information about the building and the count of living and working population are displayed in the card.
- The location of the building is indicated on the map.
You can manually edit the list of filtering results to keep only selected buildings in the data sample. Click Edit list, select the required buildings, and click Apply.
To save this data sample and customize its visualization (for example, as a heatmap), click Create layer.
Filters
For the Population dataset, the following filters are available:
- Living population: count of residents in the building.
- Working population: count of employees in the building.
To reset the parameter filter, click ![]() icon next to the filter name. To reset all parameter filters, click Reset filters at the bottom of the tab.
icon next to the filter name. To reset all parameter filters, click Reset filters at the bottom of the tab.
To hide the filter by territory, in the Geofilter settings dialog, click ![]() icon next to the geofilter name. To delete the geofilter, click
icon next to the geofilter name. To delete the geofilter, click ![]() icon next to its name. To delete all geofilters, click Clear filters.
icon next to its name. To delete all geofilters, click Clear filters.
Data visualization
The following visualization methods are available for the dataset:
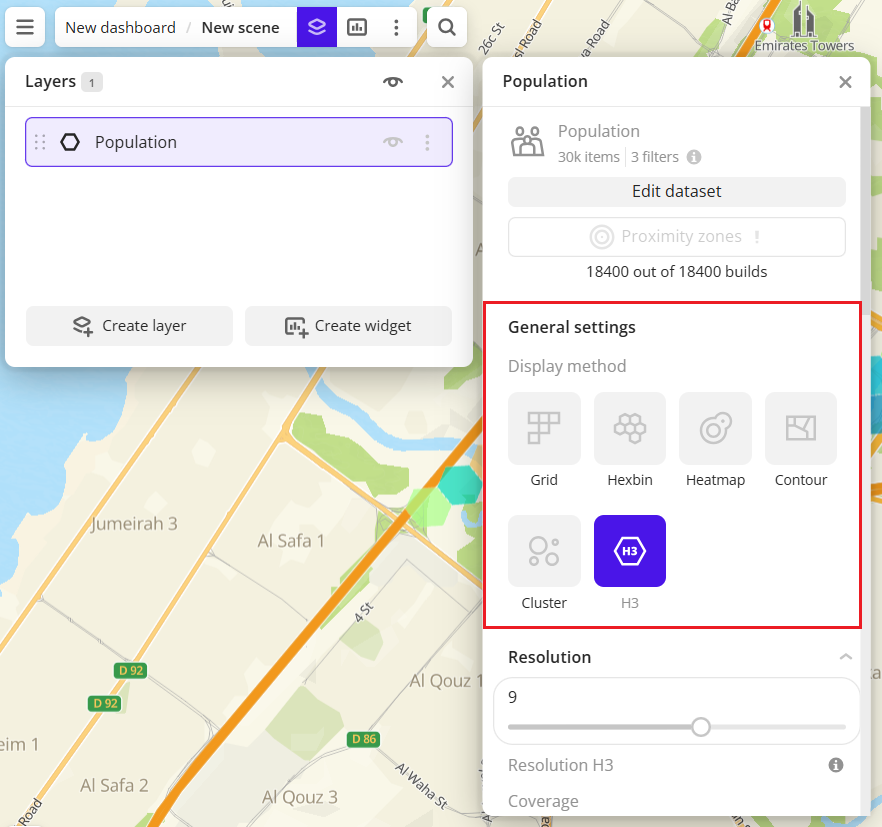
After creating the layer, configure a basic data visualization:
-
Select the H3 visualization method:
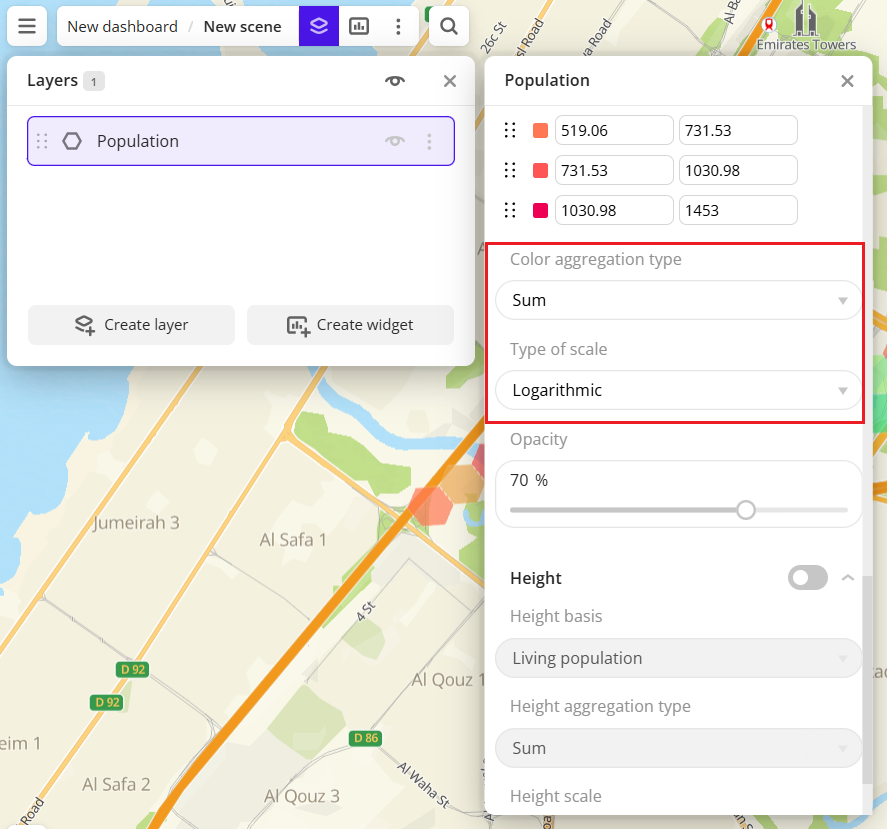
-
Configure the aggregation of visualization elements:
- In the Color aggregation type field, select Sum.
- In the Type of scale field, select Logarithmic.
Data purchasing
You can purchase data separately as an export in the following formats:
- Table formats:
.csv.txt.json
- Formats for storing geographic data:
.shp(Shape).gpkg(GeoPackage).geojson(GeoJSON)
For more information about the price, available territories, and how to purchase data, fill out the form on urbi.ae.
What's next?
- Quick start.
- Get to know more about other Data categories.
- Get to know how to work with Data visualization.
- Get to know more about Layers, Dashboards, Scenes, and Widgets.
- Get to know prepared Analytics presets.