Proximity zones
Proximity zone is an area which boundaries can be reached by the chosen method of transportation (on foot, by car, or by public transport) within a certain period of time. You can build proximity zones for several objects at once and calculate statistics within these zones (for example, the total number of residents within a 15-minute walking proximity zone).
Example scenario: build a coverage area for clinics within a 20-minute walk to make a decision about opening an additional department of the clinic.
Important
The functionality is not available in the demo tariff. To start working with proximity zones, change the tariff.
When you create proximity zones, a new layer is created. Proximity zones are built for each object in the existing data sample. If you need to create a sample that contains objects only from a specific proximity zone built around a point on the map, use geofilters.
Building proximity zones
-
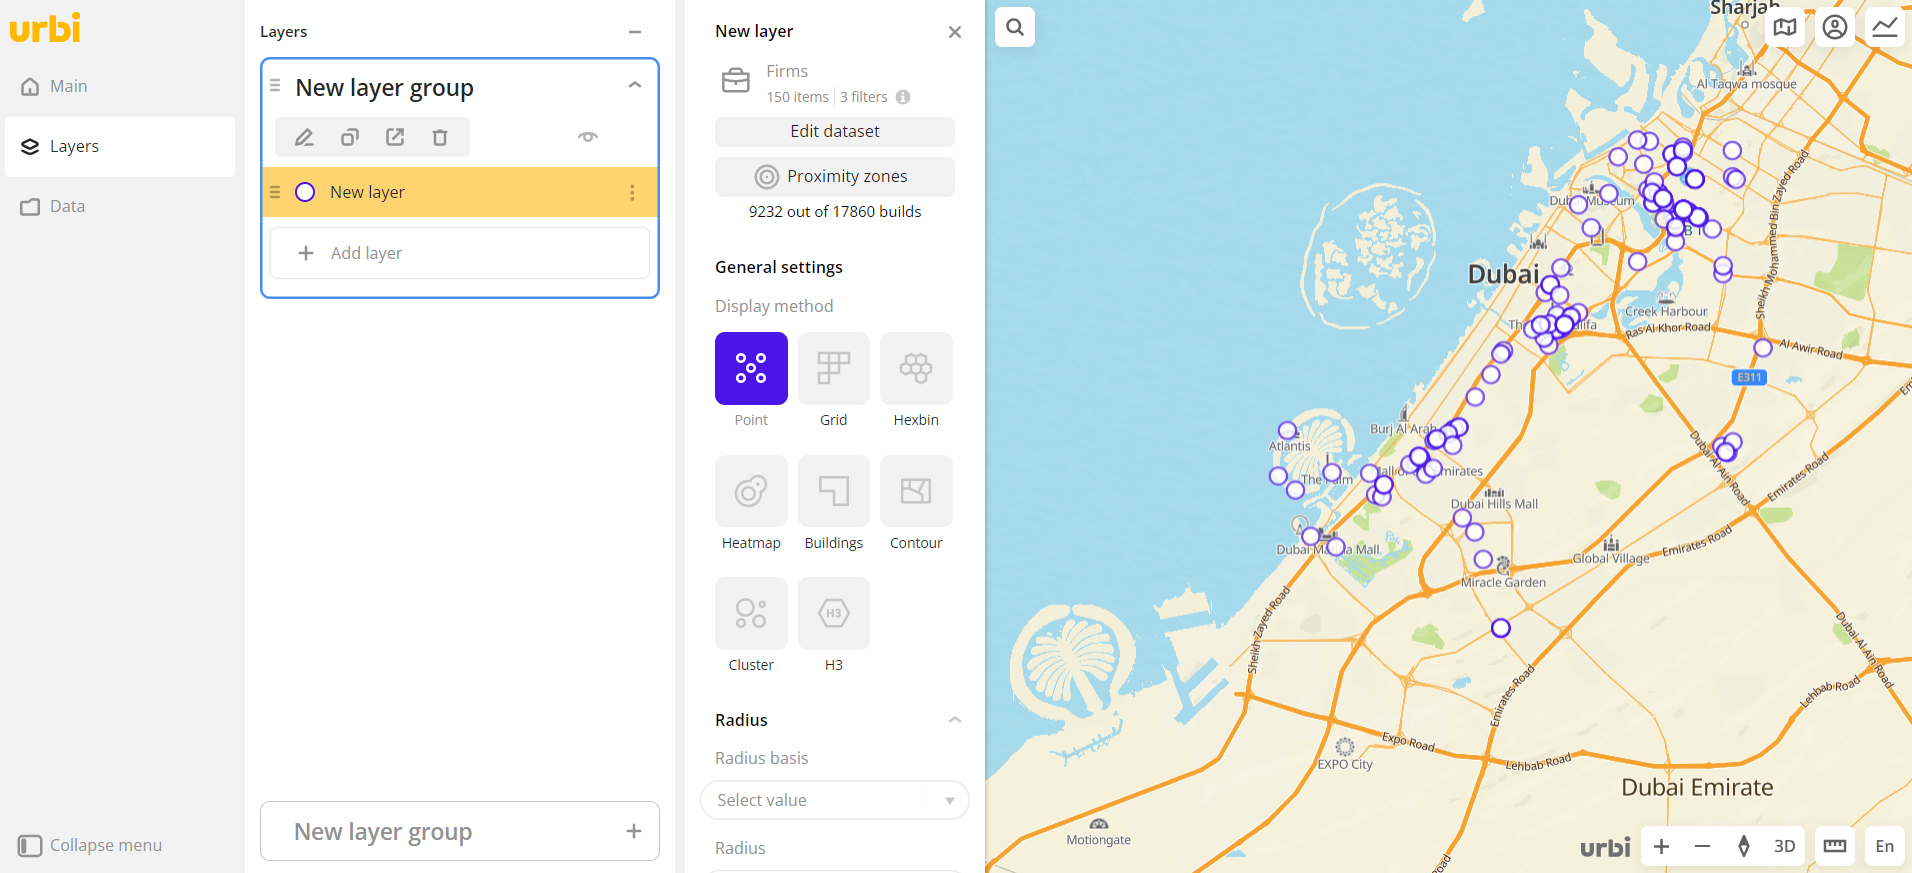
Create a layer with the objects you are interested in. The data visualization method does not matter.
-
Modify a data sample to ensure that no more than 500 objects remain in the sample.
-
Go to the Dashboards tab.
-
Open the required dashboard.
-
Open a scene using the arrows
 and
and  . If there is only one scene in the dashboard, it opens automatically when you open the dashboard.
 -
To open the layer, click
 icon and select the required layer.
 -
Click Proximity zones.
-
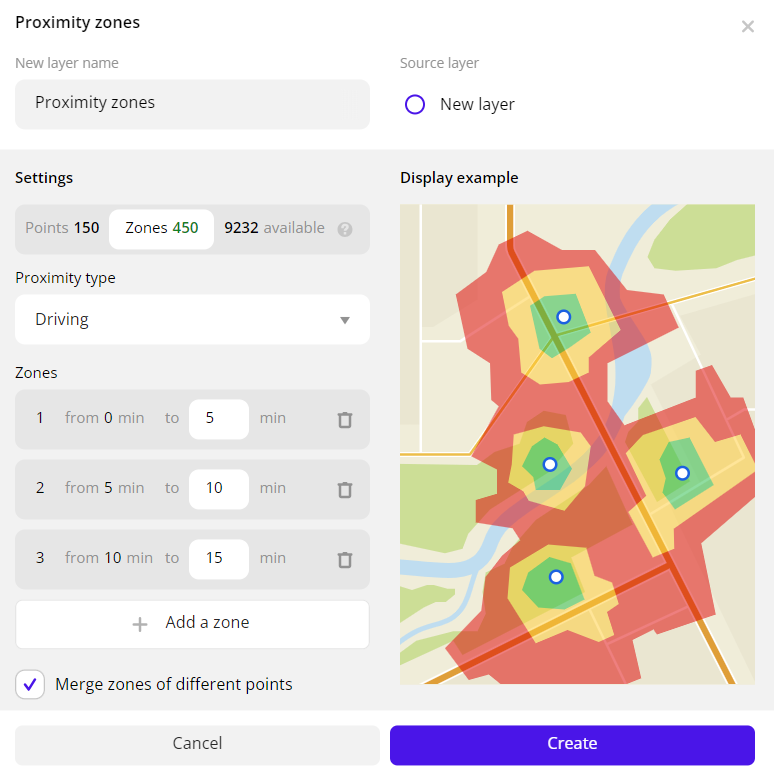
Set the proximity zone parameters:
-
New layer name: name of the resulting layer.
-
Source layer: layer for which objects proximity zones are built.
-
Proximity type: type of proximity to objects:
Walking,Driving, orBy public transport. -
Zones:
- Configure the number of steps (from 1 to 5, the default value is 3). To add a step, click Add a zone. To delete a step, click
 icon next to the necessary step.
 - Configure the size of each step (from 0 to 300 minutes from the point or the polygon centre). By default, a new step is added with a gap of 5 minutes.
- Configure the number of steps (from 1 to 5, the default value is 3). To add a step, click Add a zone. To delete a step, click
-
Merge zones of different points: enable the option to merge overlapping zones into one. If the option is disabled, intersections of proximity zones are shown on the resulting layer.
-
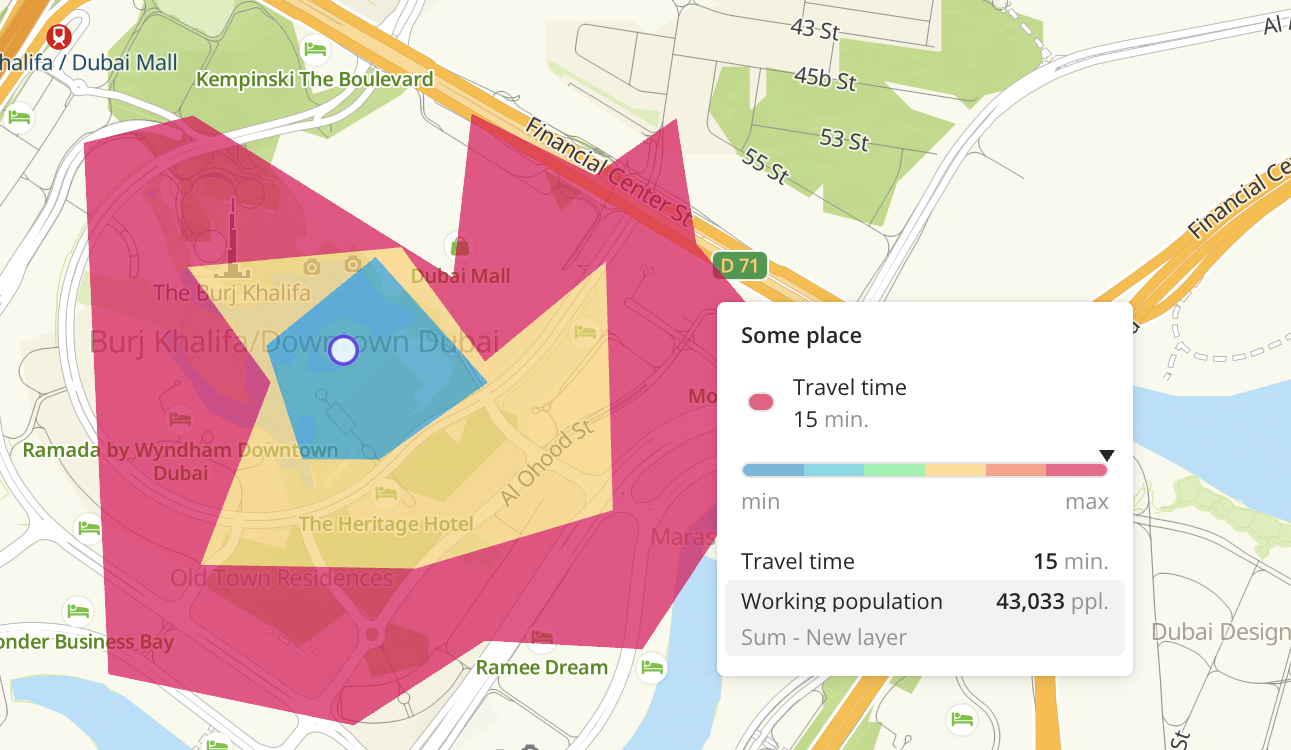
Cut inner zones: enable the option to cut inner zones (with shorter time) from outer zones (with longer time).
-
If the option is enabled, it helps to avoid data duplication and to analyze each proximity zone separately. For example, the values of the number of residents in the zone "from 10 to 15 minutes" will not be added up to the values from the zones "from 0 to 5 minutes" and "from 5 to 10 minutes".
-
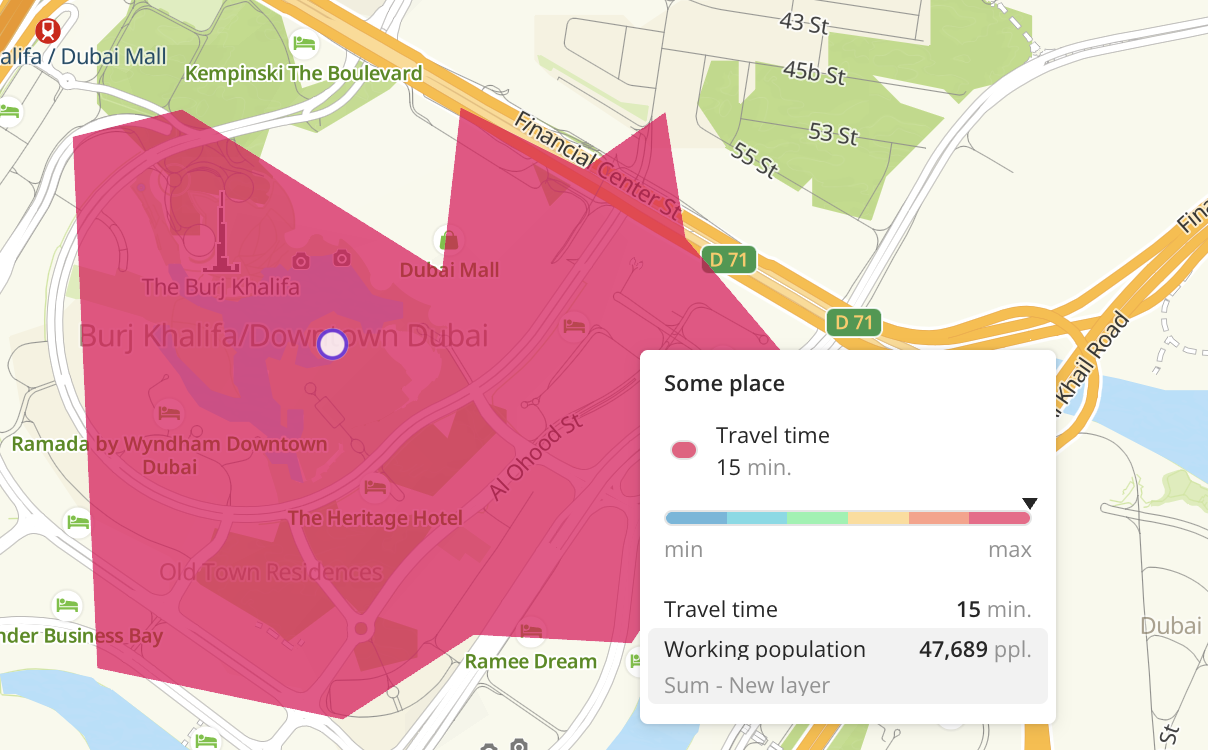
If the option is disabled, zones are created with accumulation: each subsequent zone includes data from all previous zones. For example, the "from 10 to 15 minutes" zone will include the total number of residents within a 15-minute proximity from the point.
-
-
-
Click Create.
A new layer is created and automatically added to the current dashboard scene.
Limits
The number of proximity zones that you can build is limited. Limits for each parameter are displayed in the proximity zones settings dialog:
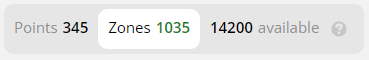
- Points: number of points for which proximity zones are built.
- Zones: number of proximity zones that are built for these points.
- Available: number of remaining requests for building proximity zones according to your tariff. A request is building one proximity zone for a single point or a polygon center. To increase the limit, contact the sales department.
Zones management
You can configure proximity zones on the created layer:
- To change parameters used for building zones and learn about current limits, click Set steps.
- To aggregate data within proximity zones (for example, to display the number of objects in each zone), click Aggregate data. For more information, see the Data aggregation instruction.
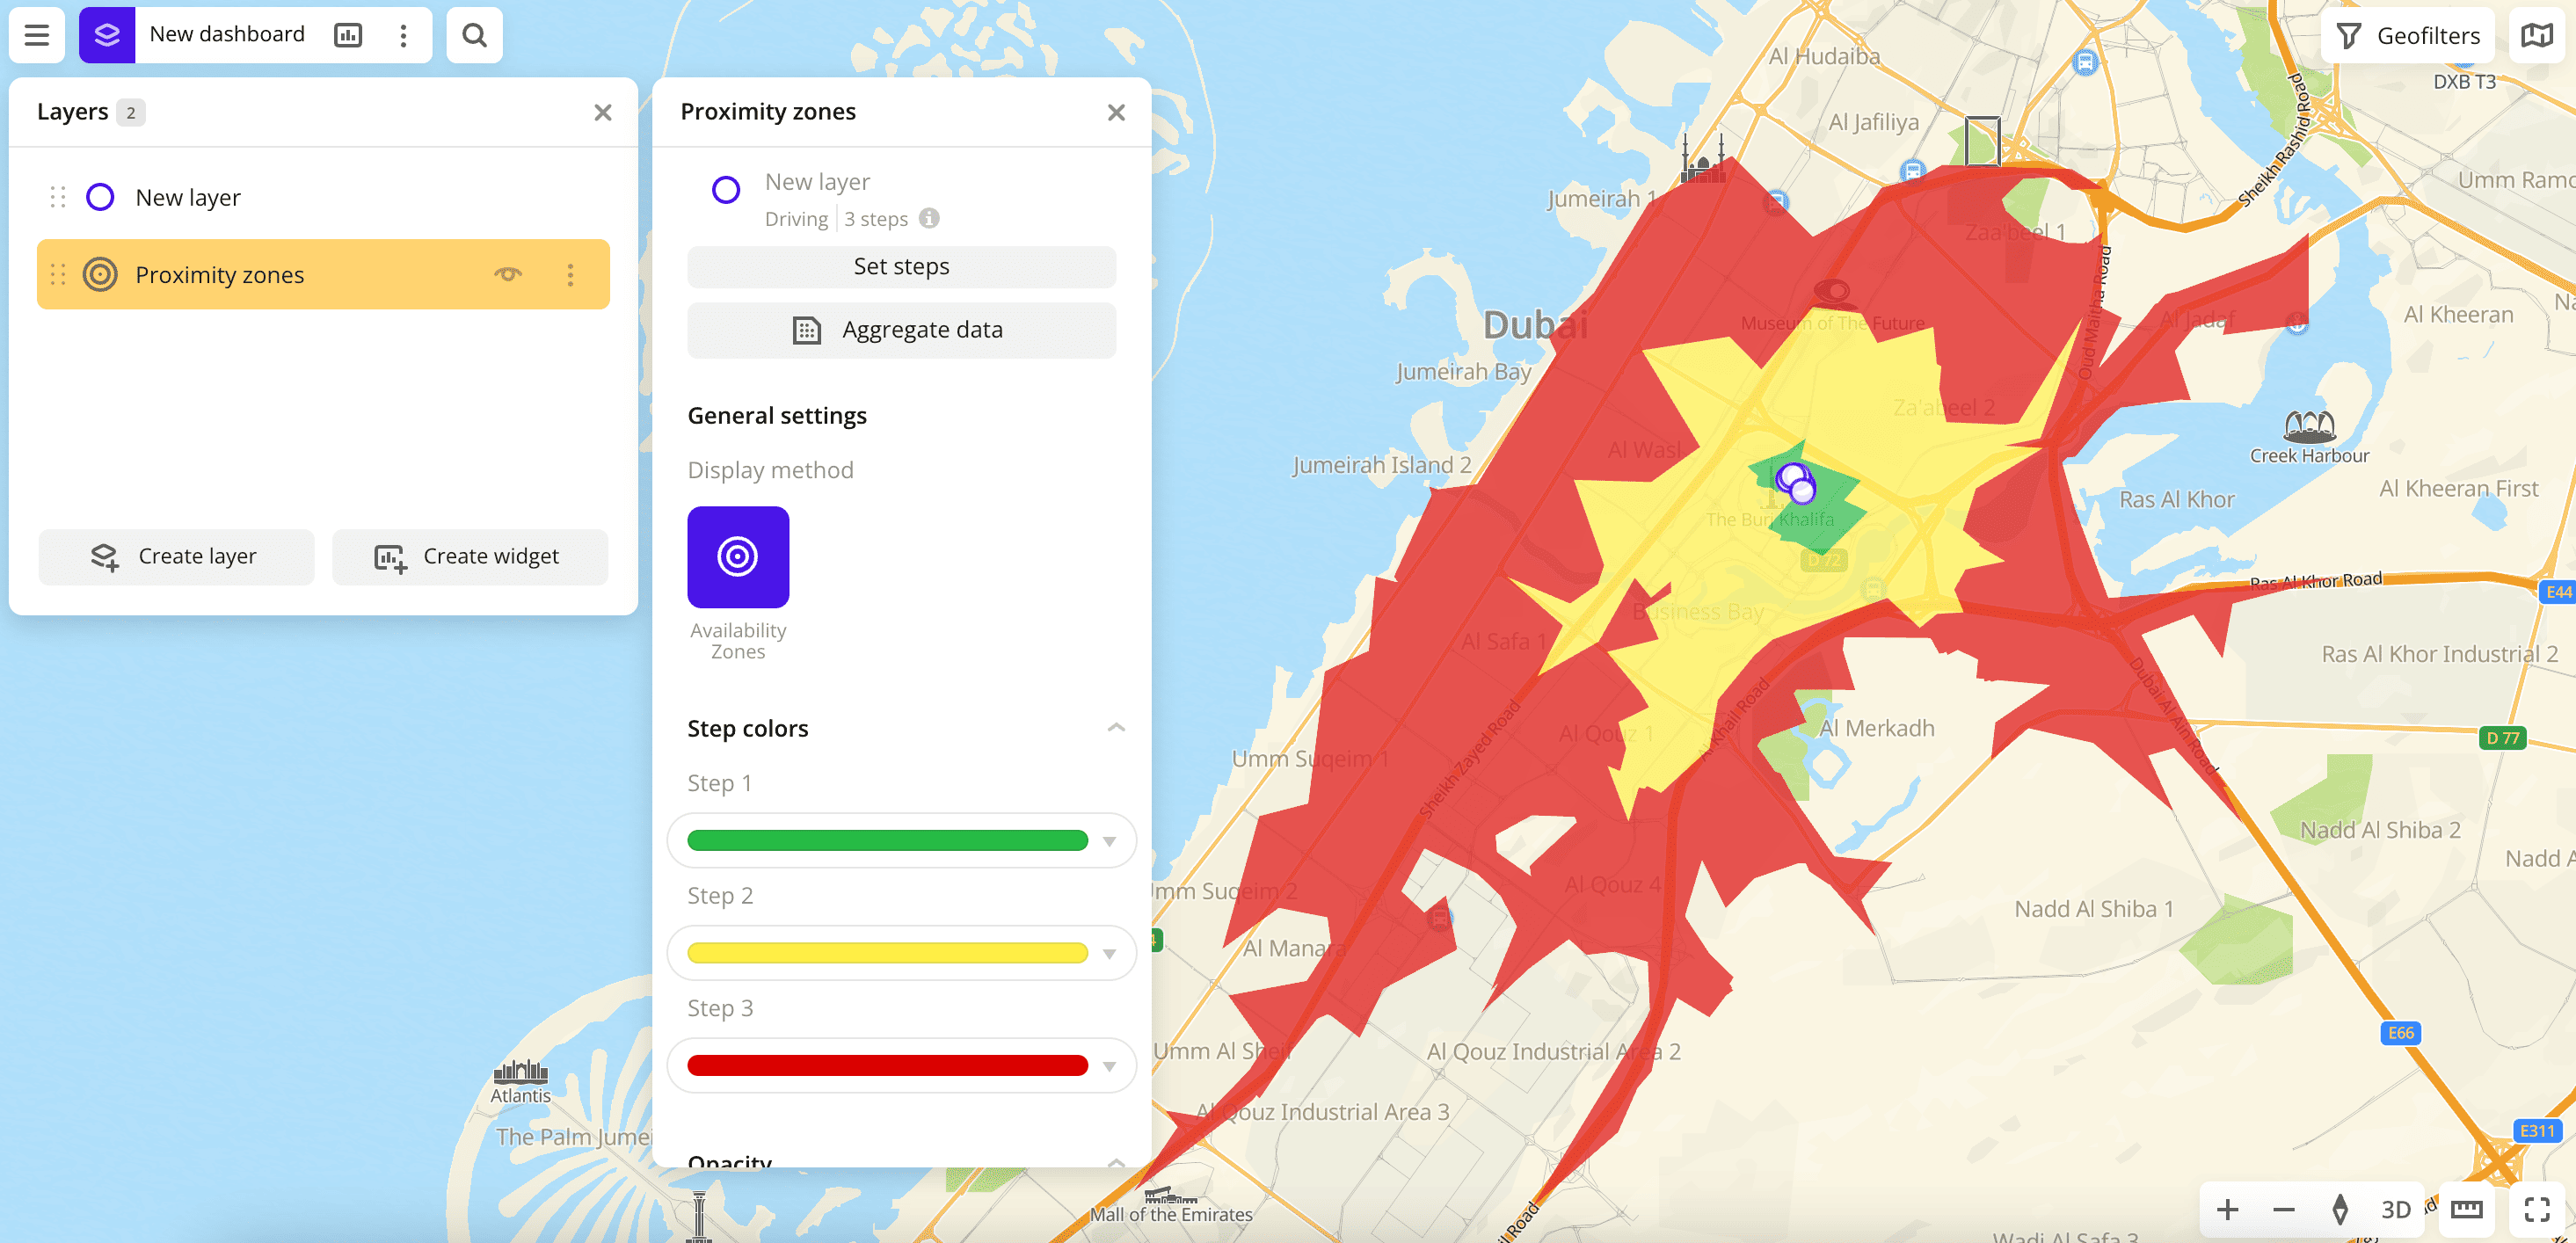
Visualization settings
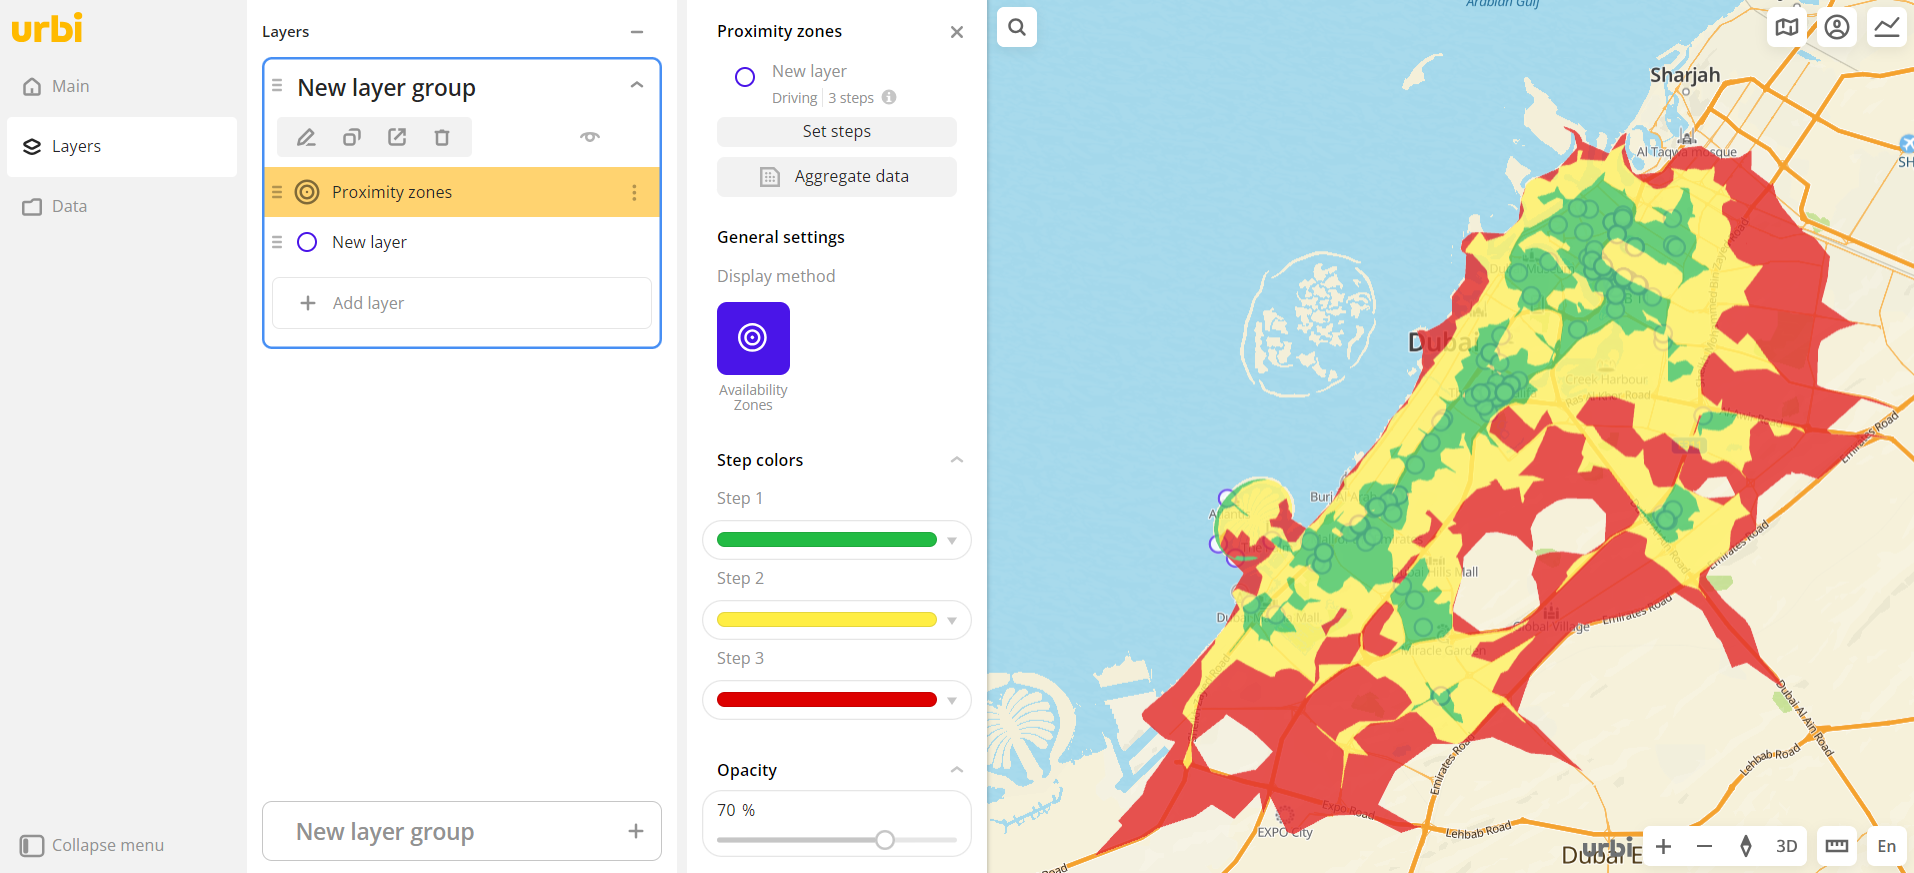
- Step colors: selecting a color scale of data display. To change the default step colors, click the color scale of the step and enter a new color value in HEX format.
- Opacity: adjustment of the transparency of displaying elements on the map.
What's next?
- Quick start.
- Get to know how to work with Data.
- Get to know how to Aggregate data.
- Get to know more about Layers, Dashboards, Scenes, and Widgets.
- Get to know more about other Data visualization methods.
- Get to know prepared Analytics presets.