Firms
The Firms dataset provides information about organizations from the Urbi directory.
Usage scenarios
The Firms dataset helps to solve different problems:
- Competitive environment analysis. It allows you to research the number and the density of competitor locations in the required category within a specific area.
- Selecting a location for opening a business. It helps to select the optimal location for opening a new business using data on the density of firm locations and the count of reviews. For example, find a residential area without competitors to open a flower shop.
- Selecting a type of business. It helps to determine the type of business with minimal competition, identify untapped niches, and be the first to enter the market. For example, the data can show which areas lack pharmacies or repair points within walking distance of residential areas.
- Urban planning. It helps municipalities and city administrations to assess the saturation of an area with social organizations and household services.
How is the data collected?
The data about organizations is obtained from the Urbi directory. It is regularly collected and verified by Urbi specialists.
Data update and history
- Update frequency: data is updated once a week.
- History: historical data is not available. You can only view the latest updated data.
Available territories
Data is available for the following countries:
- Bahrain
- Kuwait
- Oman
- Qatar
- Saudi Arabia
- UAE
The data may not be available throughout the entire country, but only in populated areas where Urbi is present. To check data availability, use geofilters or contact the technical support.
Data availability
- On-Cloud (Urbi Pro service): data is available upon request and is partially available in the demo tariff. To start working with full data, change the tariff and request access to the dataset.
- On-Premise (installation of the service in a private environment): data is available.
Getting started
- Go to the Main or Data tab.
- Select the Firms dataset.
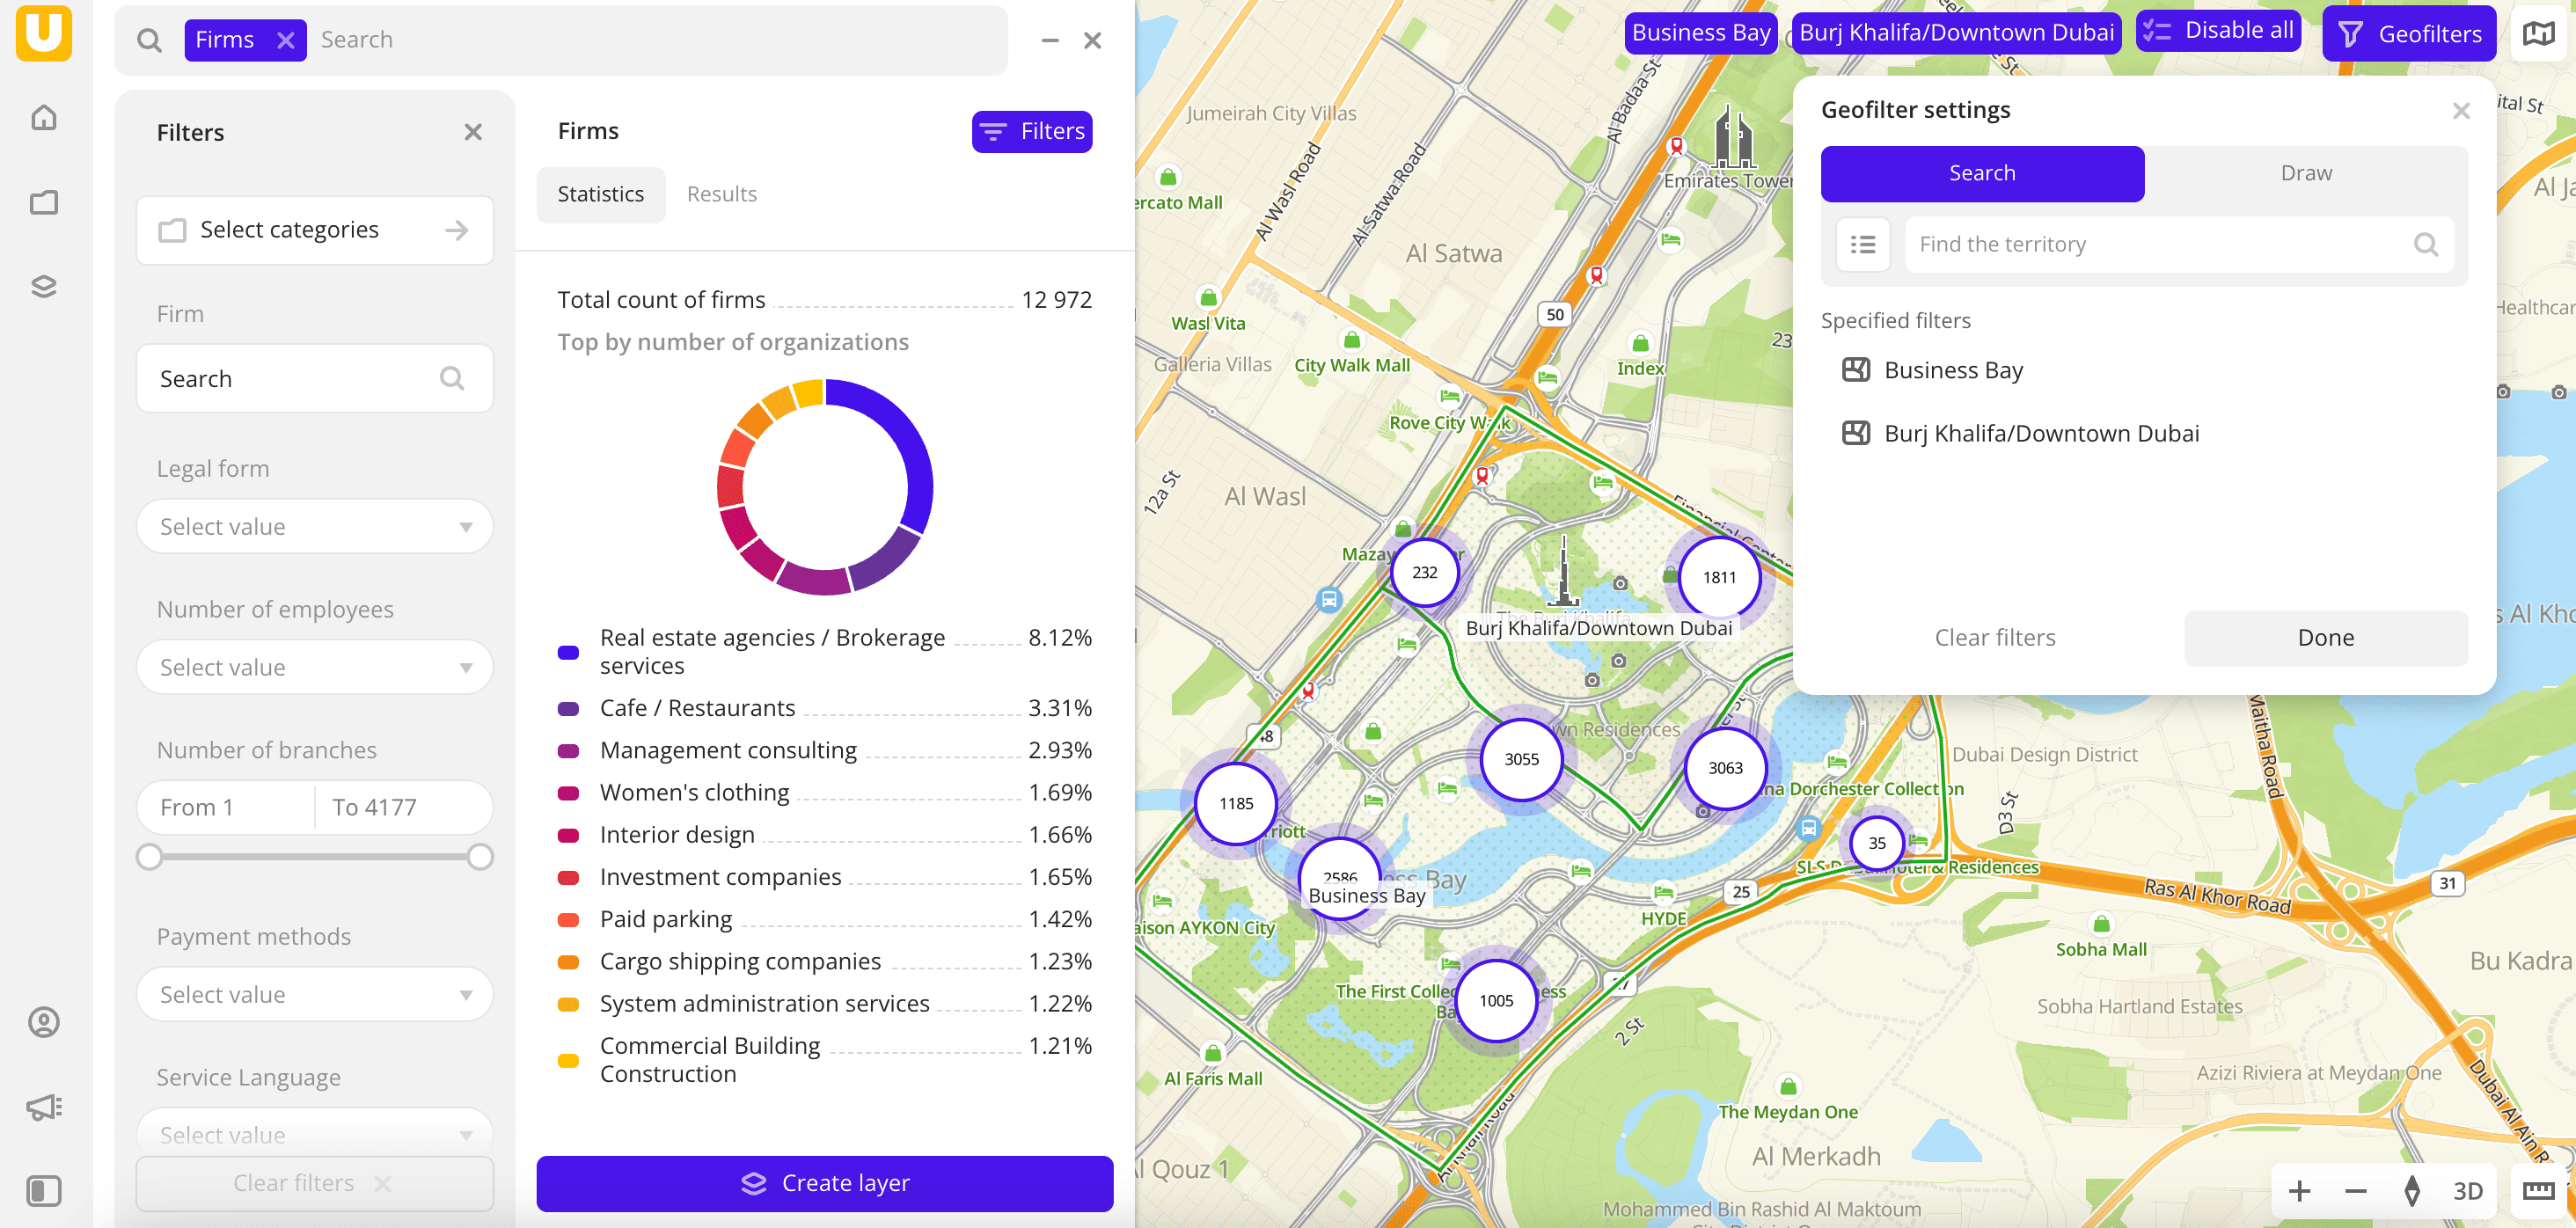
- In the Geofilter settings dialog, select up to 50 territories for which the data sample is created. You can use standard and custom territories and also build polygons, proximity zones, and circles on the map. For more information, see the Geofilters section. After you select the territories, click Done.
- On the Filters tab, select the basic filter for data analysis: Categories. To view data about organizations in a particular category, click Select categories, select one or more categories, and click Apply. For example, select Food service → Pastry shops.
- Set the remaining filters if necessary.
The data is displayed on the map as points. Filtering results are available on two tabs:
-
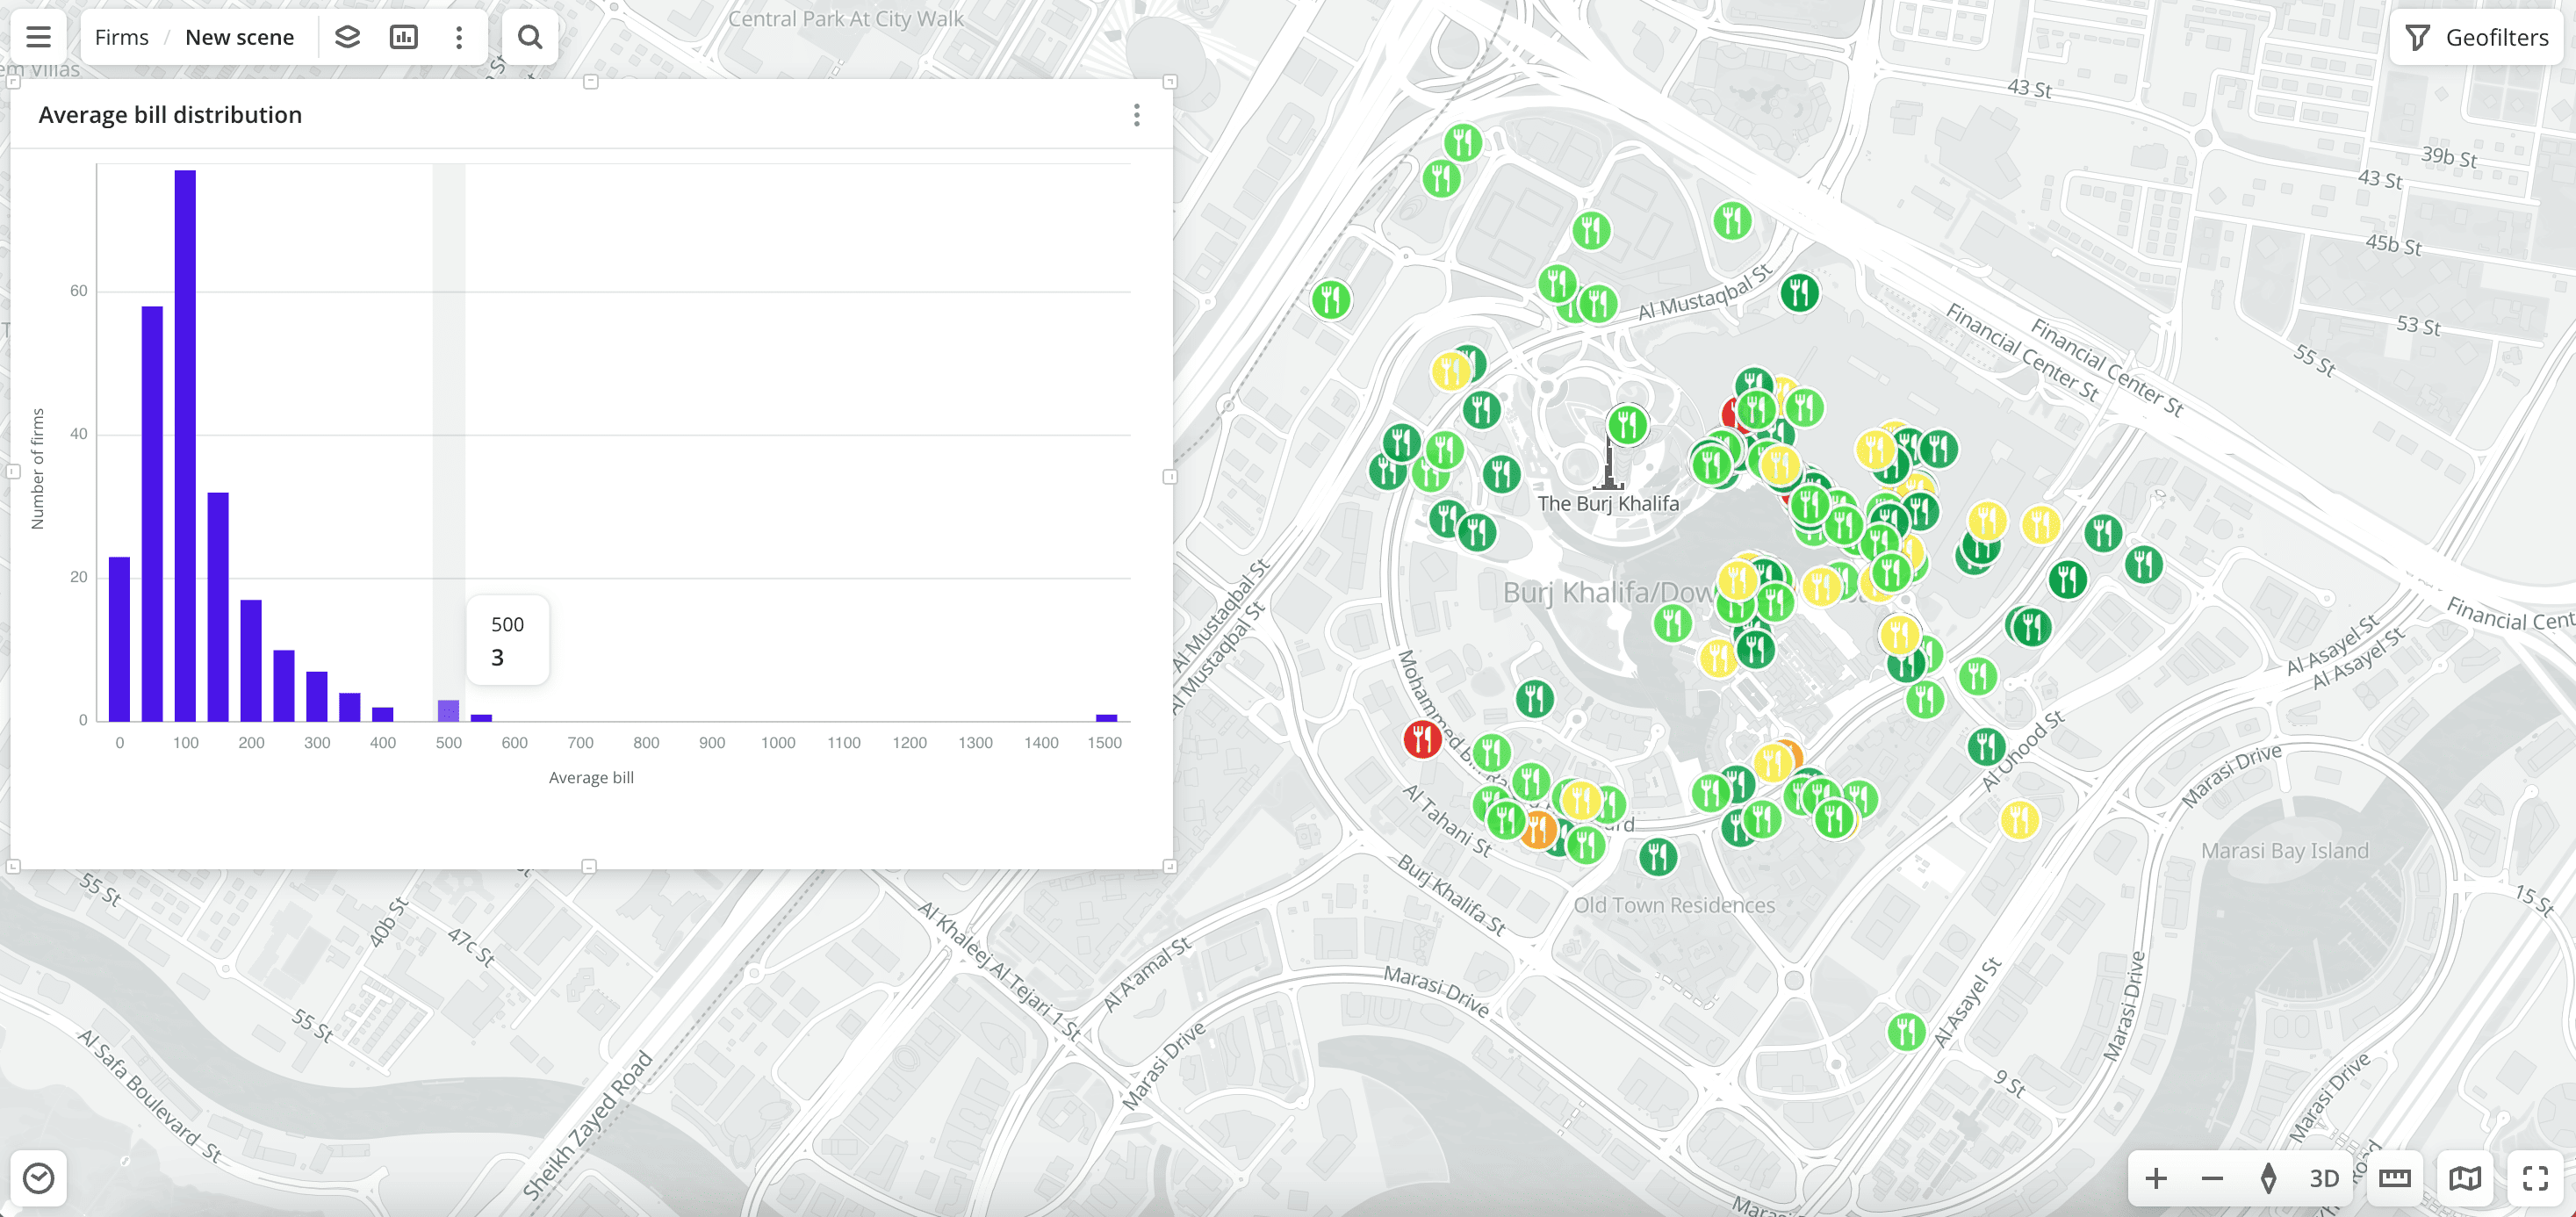
Statistics: general statistics about the sample:
- Total count of organizations.
- Chart with the percentage distribution of organizations by subcategory. Displayed if multiple subcategories are selected.
- Chart with the distribution of organizations by the number of employees.
- Maximum and average count of branches.
- Chart with the distribution of organizations by the number of branches.
-
Results: general information about organizations and their list. When selecting an organization from the list:
- Information about the organization is displayed in the card.
- The location of the organization is indicated on the map.
You can manually edit the list of filtering results to keep only selected organizations in the data sample. Click Edit list, select the required organizations, and click Apply.
To save the data sample, click Create layer and customize data visualization.
Filters
For the Firms dataset, the following filters are available:
-
Categories: categories of organizations in the directory. More than 1500 subcategories are also available (e.g., category
Food servicecontains thePastry shopssubcategory).You can select multiple categories and subcategories. Click Select categories, select categories from the list, and click Apply.
If an organization has multiple subcategories (e.g., Food court and Coffee shop), it displays in the filtering results even if the filter only by one subcategory is applied (e.g., Coffee shop).
-
Firm: search for a particular organization in the directory by name.
-
Legal form: legal form of the organization (for example, LLC, JSC, etc.).
-
Number of employees: count of employees in the organization.
-
Number of branches: count of branches of the organization. For example, if an organization has 10 branches, each branch's card will indicate the value
10. -
Payment methods: payment methods for services or goods (for example, cash payment, card payment, etc.).
-
Service language: service language.
-
Round the clock: select to display only organizations with a 24/7 schedule.
-
Rating: rating of the organization in the directory from
1to5. -
Number of reviews: count of reviews of the organization in the directory.
-
Additional filters: when you select particular categories, additional filters are available. For example, for the subcategory
Cafe / Restaurants, filters Seating capacity, Average bill, and others are available. You can see the full list of filters when selecting the required category. Examples of filters:- Wheelchair Accessible: organizations with an accessible entrance.
- Delivery: delivery service is available.
To reset the parameter filter, click ![]() icon next to the filter name. To reset all parameter filters, click Reset filters at the bottom of the tab.
icon next to the filter name. To reset all parameter filters, click Reset filters at the bottom of the tab.
To hide the filter by territory, in the Geofilter settings dialog, click ![]() icon next to the geofilter name. To delete the geofilter, click
icon next to the geofilter name. To delete the geofilter, click ![]() icon next to its name. To delete all geofilters, click Clear filters.
icon next to its name. To delete all geofilters, click Clear filters.
Data visualization
The following visualization methods are available for the dataset:
After creating the layer, configure a basic data visualization:
-
Select the Point visualization method:
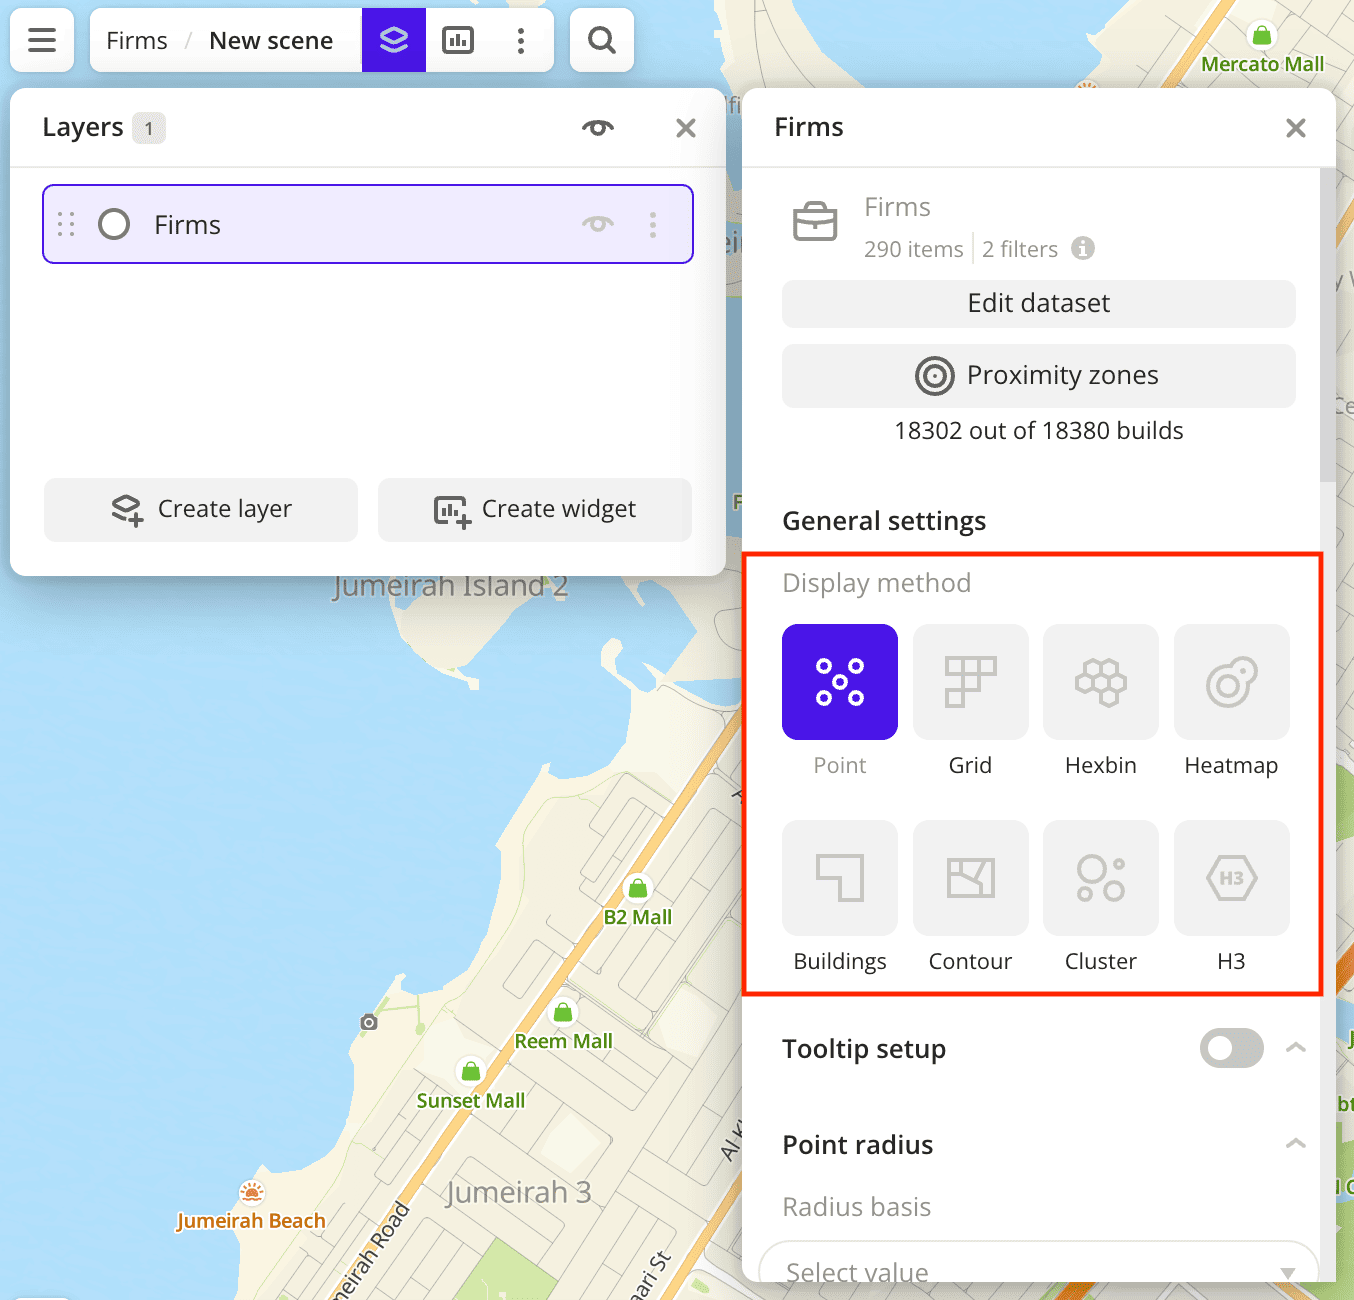
-
To configure a tooltip, enable the Tooltip setup option and select the basic data attributes:
RatingandNumber of reviews: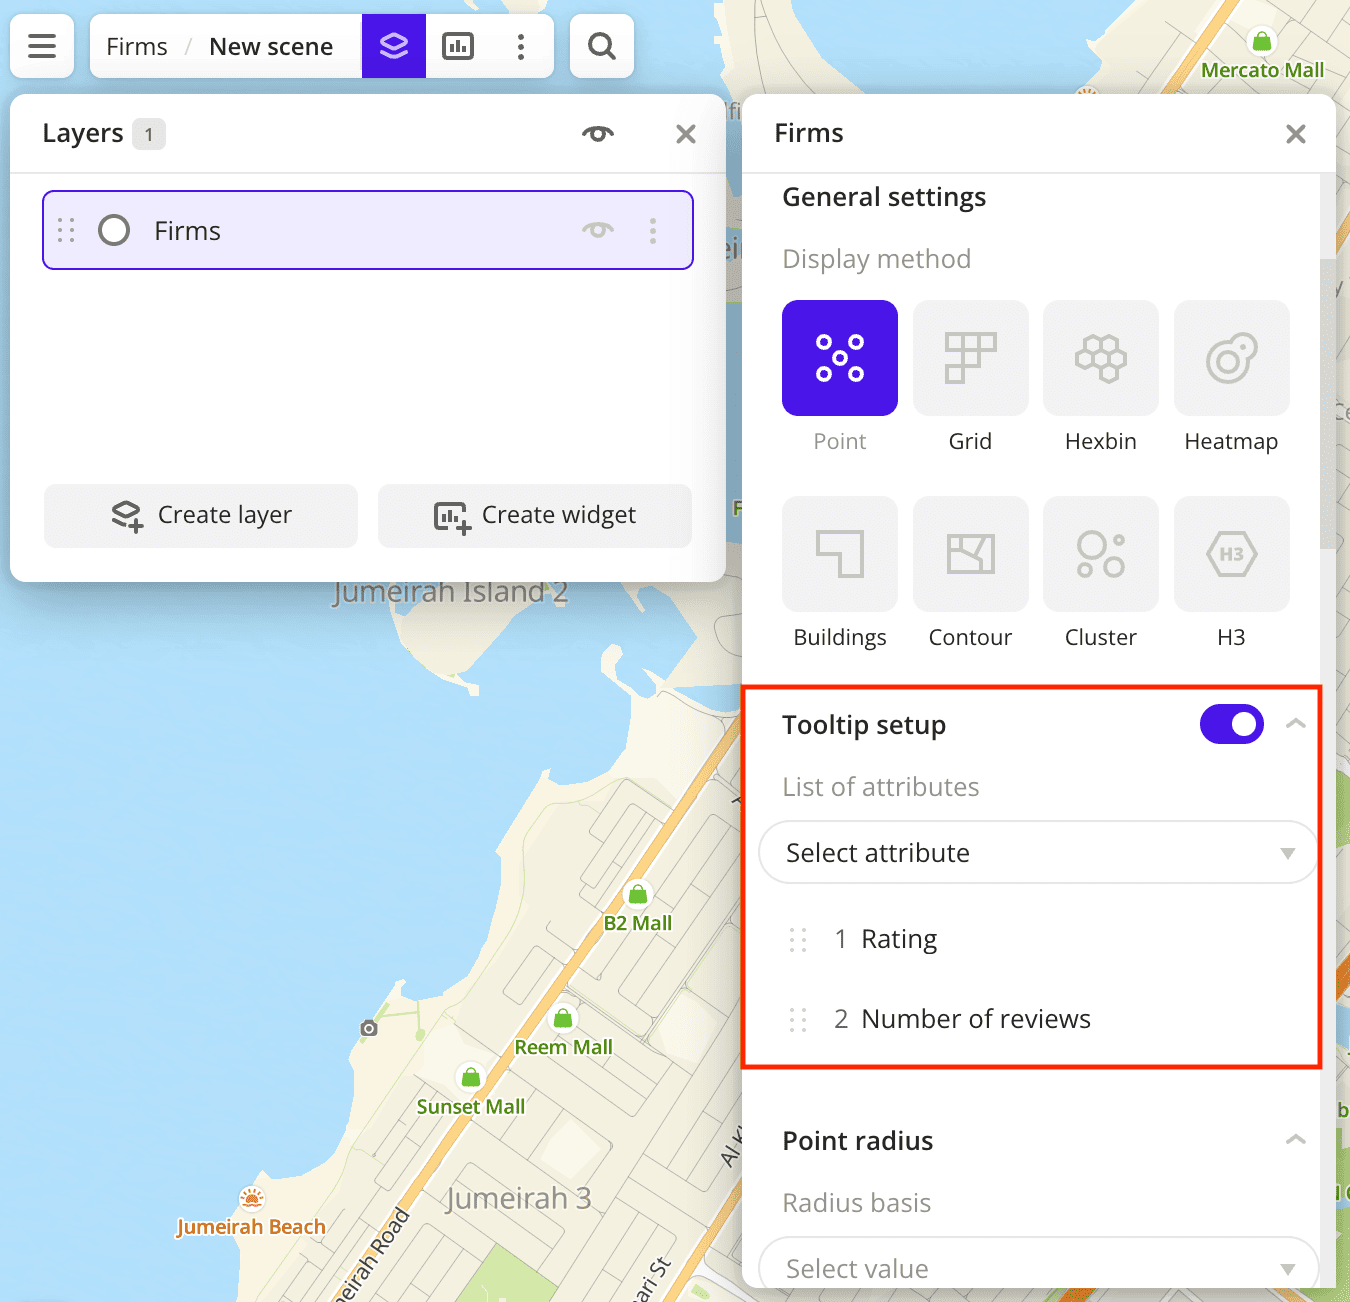
-
In the Icon field, select the required icon to display points on the map:
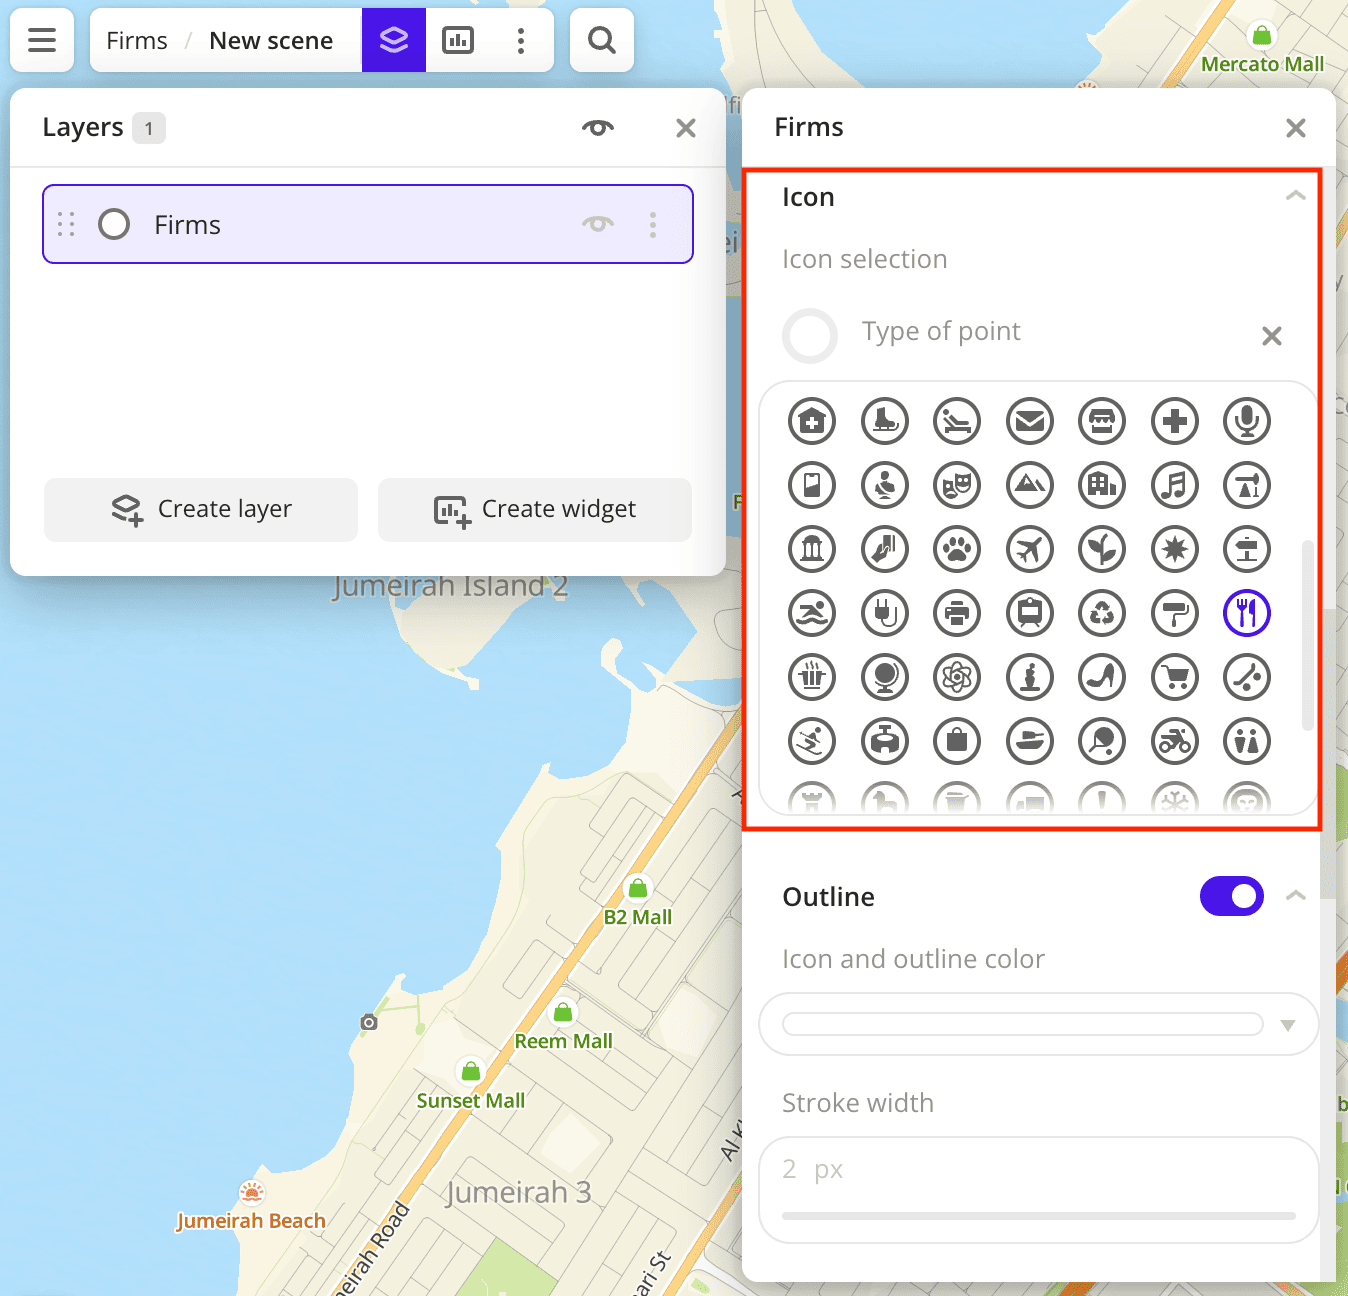
-
To analyze organization locations, change the color of the points on the map depending on the rating. In the Color basis field, select the
Ratingattribute and specify the color scale: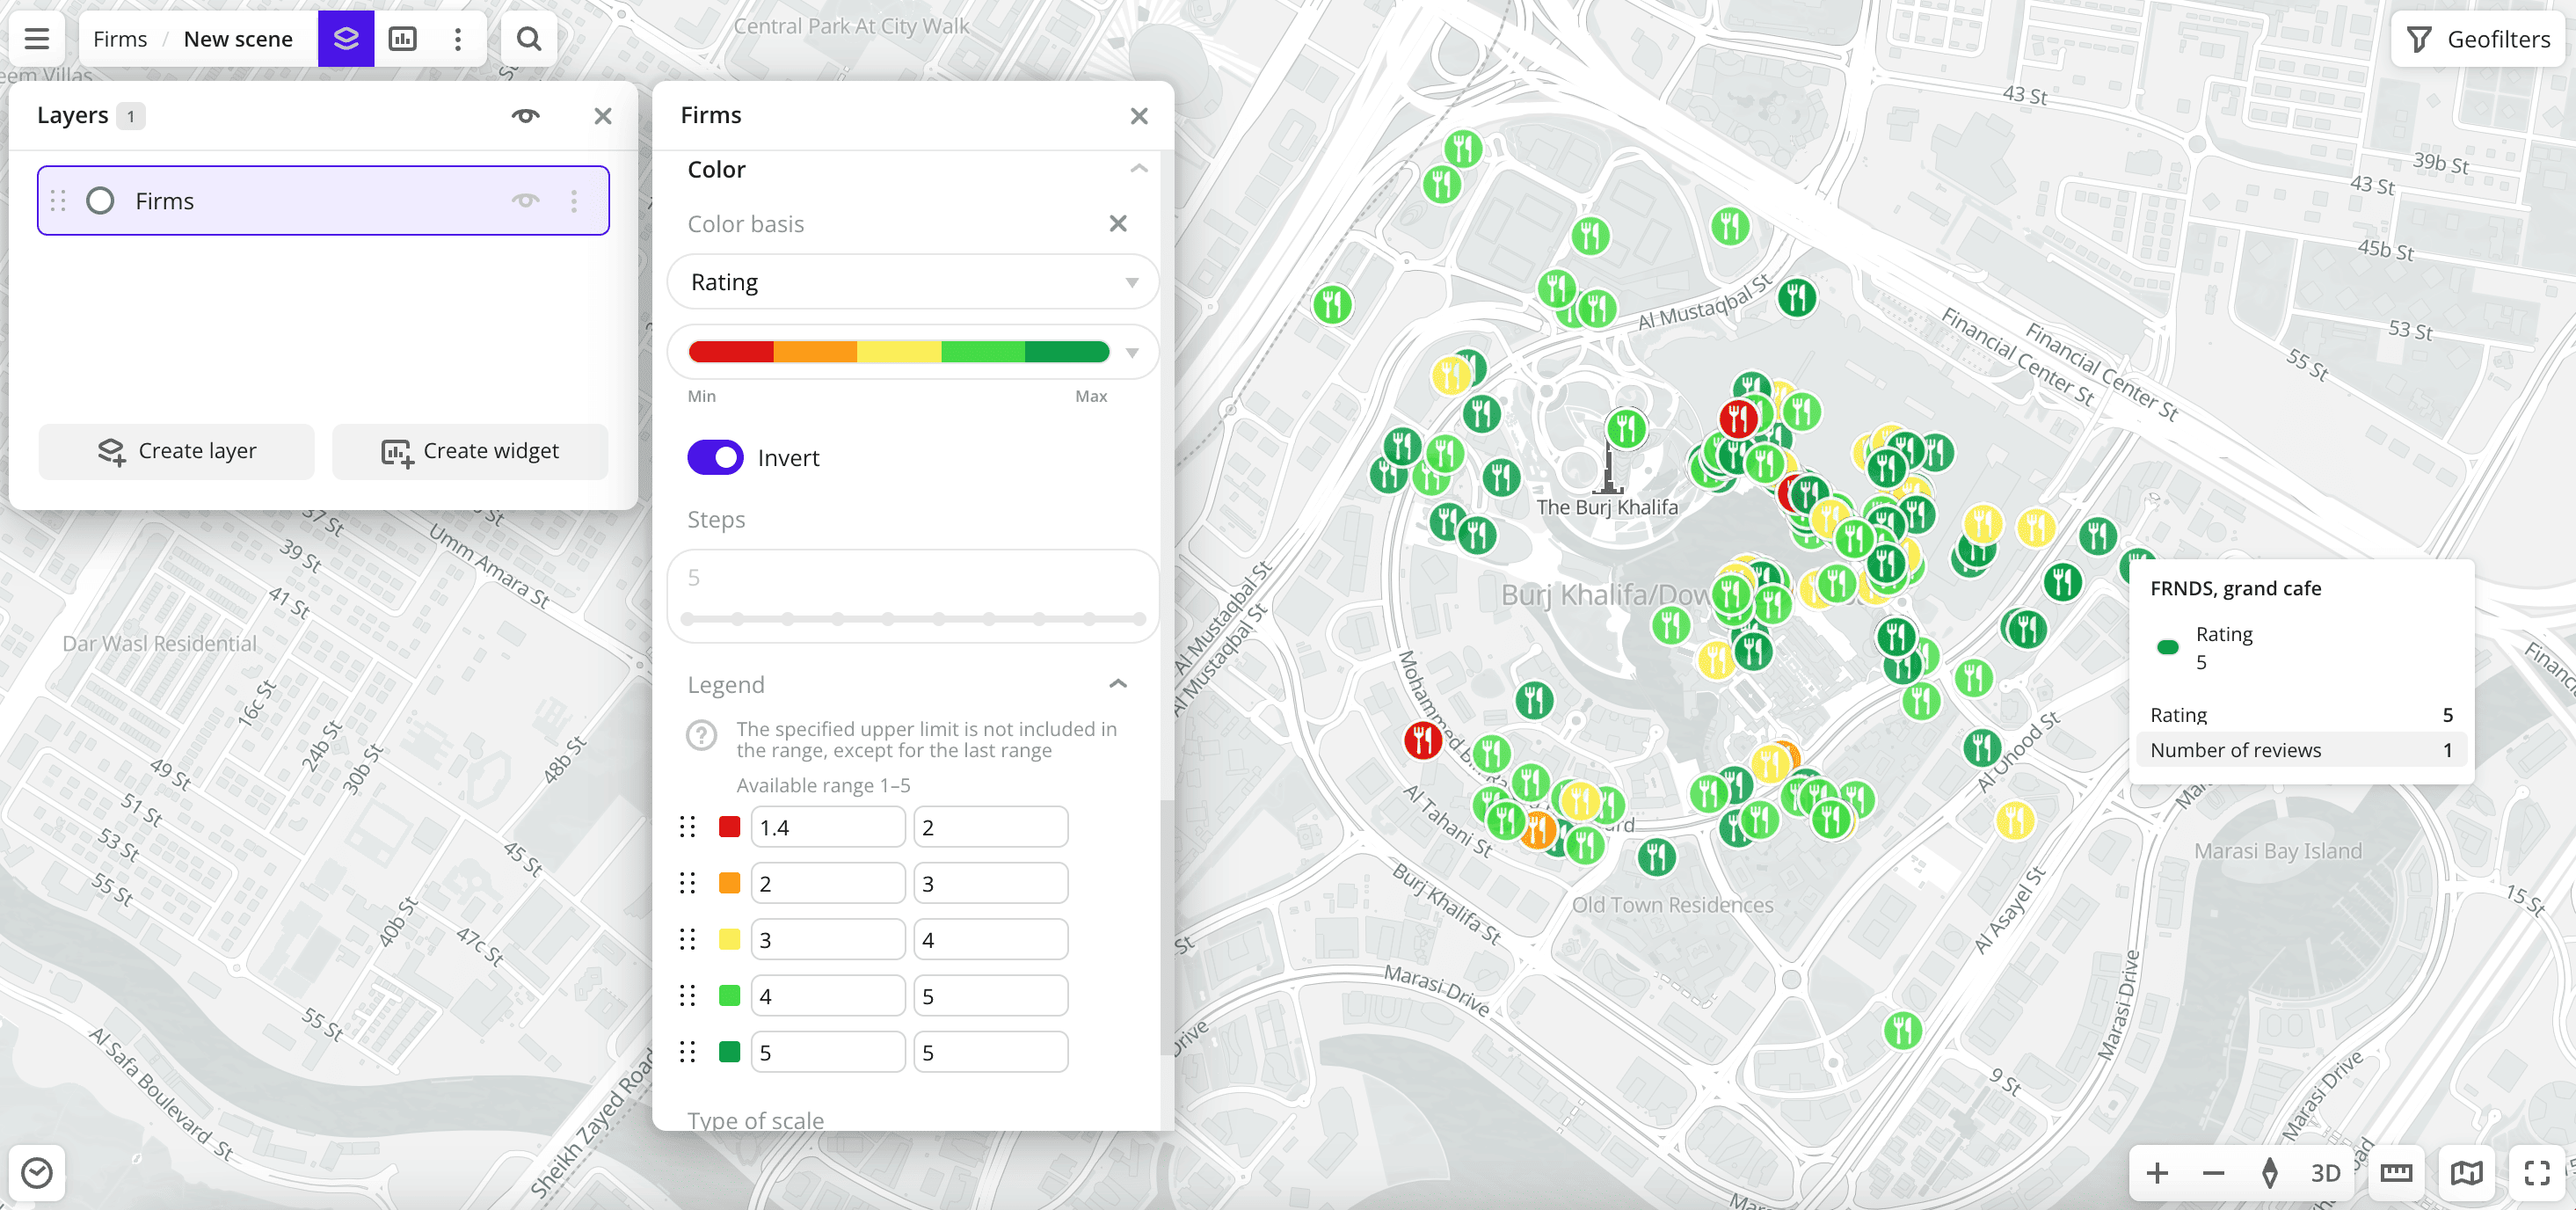
Data purchasing
You can purchase data separately as an export in the following formats:
- Table formats:
.csv.txt.json
- Formats for storing geographic data:
.shp(Shape).gpkg(GeoPackage).geojson(GeoJSON)
For more information about the price, available territories, and how to purchase data, fill out the form on urbi.ae.
What's next?
- Quick start.
- Get to know more about other Data categories.
- Get to know how to work with Data visualization.
- Get to know more about Layers, Dashboards, Scenes, and Widgets.
- Get to know prepared Analytics presets.