Car traffic (detailed)
The Detailed car traffic dataset provides information on average hourly car traffic for the last month with accuracy to roads. Traffic is grouped by weekdays and weekends.
Usage scenarios
The Detailed car traffic dataset helps to solve different problems:
- Transportation planning and road construction. It helps to determine traffic congestion and to decide on the construction of new roads and interchanges or the expansion of existing ones. For example, high car traffic in a certain area may indicate the need to improve the transport infrastructure.
- Selecting a location for opening a business. It helps to choose a place with a large number of passing cars and customer flow for a store, restaurant, gas station, etc.
- Urban planning. It helps to design residential areas, taking into account traffic flows. Traffic shows where new sidewalks, intersections, bus stops, or metro stations need to be built.
- Outdoor advertising. It helps to select locations for billboards and place advertisements on streets with high car traffic.
- Geospatial analysis. You can aggregate data or build proximity zones. For example, find out how many cars pass through a certain polygon or a proximity zone and also count the amount of traffic in a 1 km area from the store or a 15-minute proximity zone by car.
How is the data collected?
The algorithm for calculating car traffic consists of the following steps:
- Collecting GPS tracks of users of the Urbi application navigator.
- Determining unique trip identifiers that are linked to road segments.
- Using coefficients to correct data. The step helps to use not only the Urbi application data but also to show the real traffic congestion on the roads. The following indicators are used:
- Total count of Urbi application users.
- Proportion of people using cars among the population.
- Percentage of the working-age population.
- Calculating the average count of trips separately for weekdays and weekends.
- Calculating the hourly traffic separately for weekdays and weekends.
Data update and history
-
Update frequency: data is updated once a month.
-
History: historical data is not available. You can only view data for the last month. For example, if the data was updated in May, the dataset contains traffic data for April:
Available territories
Data is available for the following countries:
- Oman
- Qatar
- Saudi Arabia
- UAE
The data may not be available throughout the entire country, but only in populated areas where Urbi is present and where data on user trips is collected. To check data availability, use geofilters or contact the technical support.
Data availability
- On-Cloud (Urbi Pro service): data is available upon request and is not available in the demo tariff. To start working with the data, change the tariff and request access to the dataset.
- On-Premise (installation of the service in a private environment): data is not available.
Getting started
-
Go to the Main or Data tab.
-
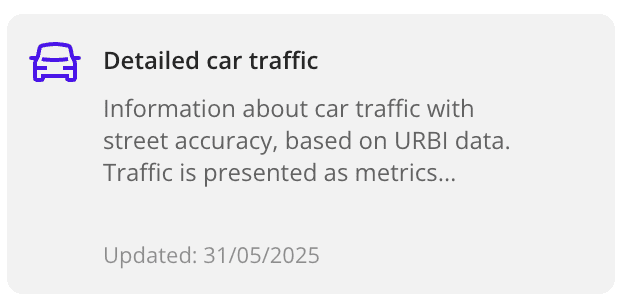
Select the Detailed car traffic dataset.
-
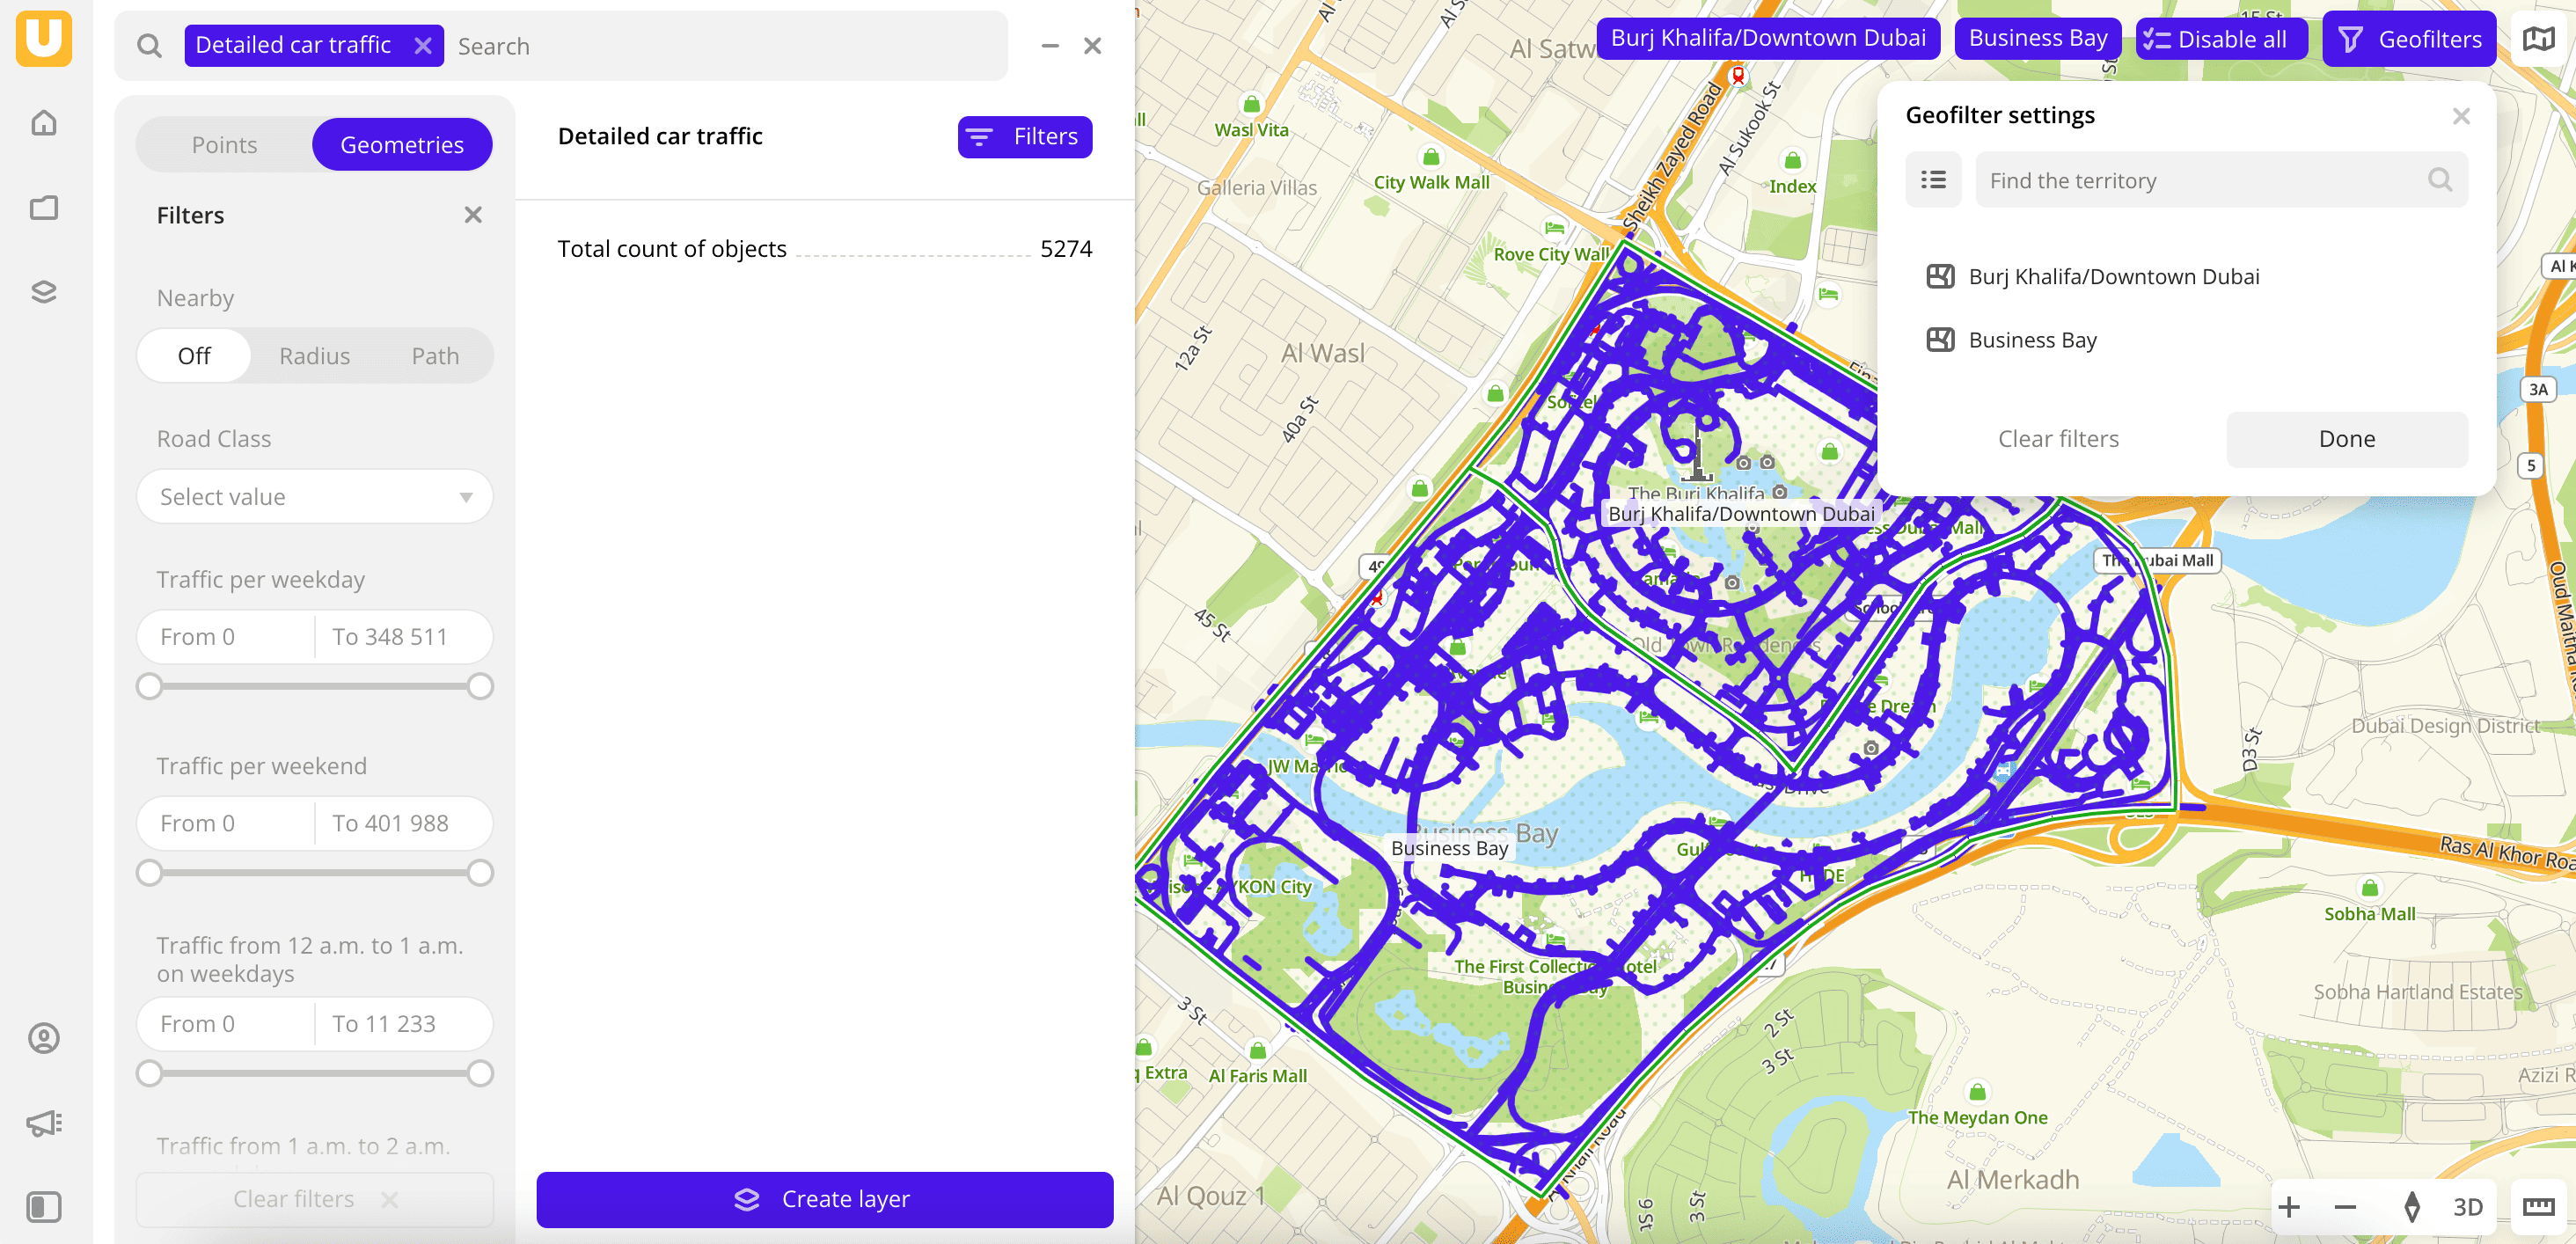
In the Geofilter settings dialog, select up to 50 territories for which the data sample is created. You can use standard and custom territories and also build polygons, proximity zones, and circles on the map. For more information, see the Geofilters section. After you select the territories, click Done.
-
On the Filters tab, select basic filters for data analysis:
- To view traffic data on weekdays, select the Traffic per weekday filter.
- To analyze hourly traffic, select the traffic filter for a certain hour (Traffic from ... to ... on weekdays or Traffic from ... to ... on weekends).
-
Set the remaining filters if necessary.
The data is displayed on the map. The total count of objects is available in the filtering results.
To save the data sample, click Create layer and customize data visualization.
Filters
For the Detailed car traffic dataset, the following filters are available:
-
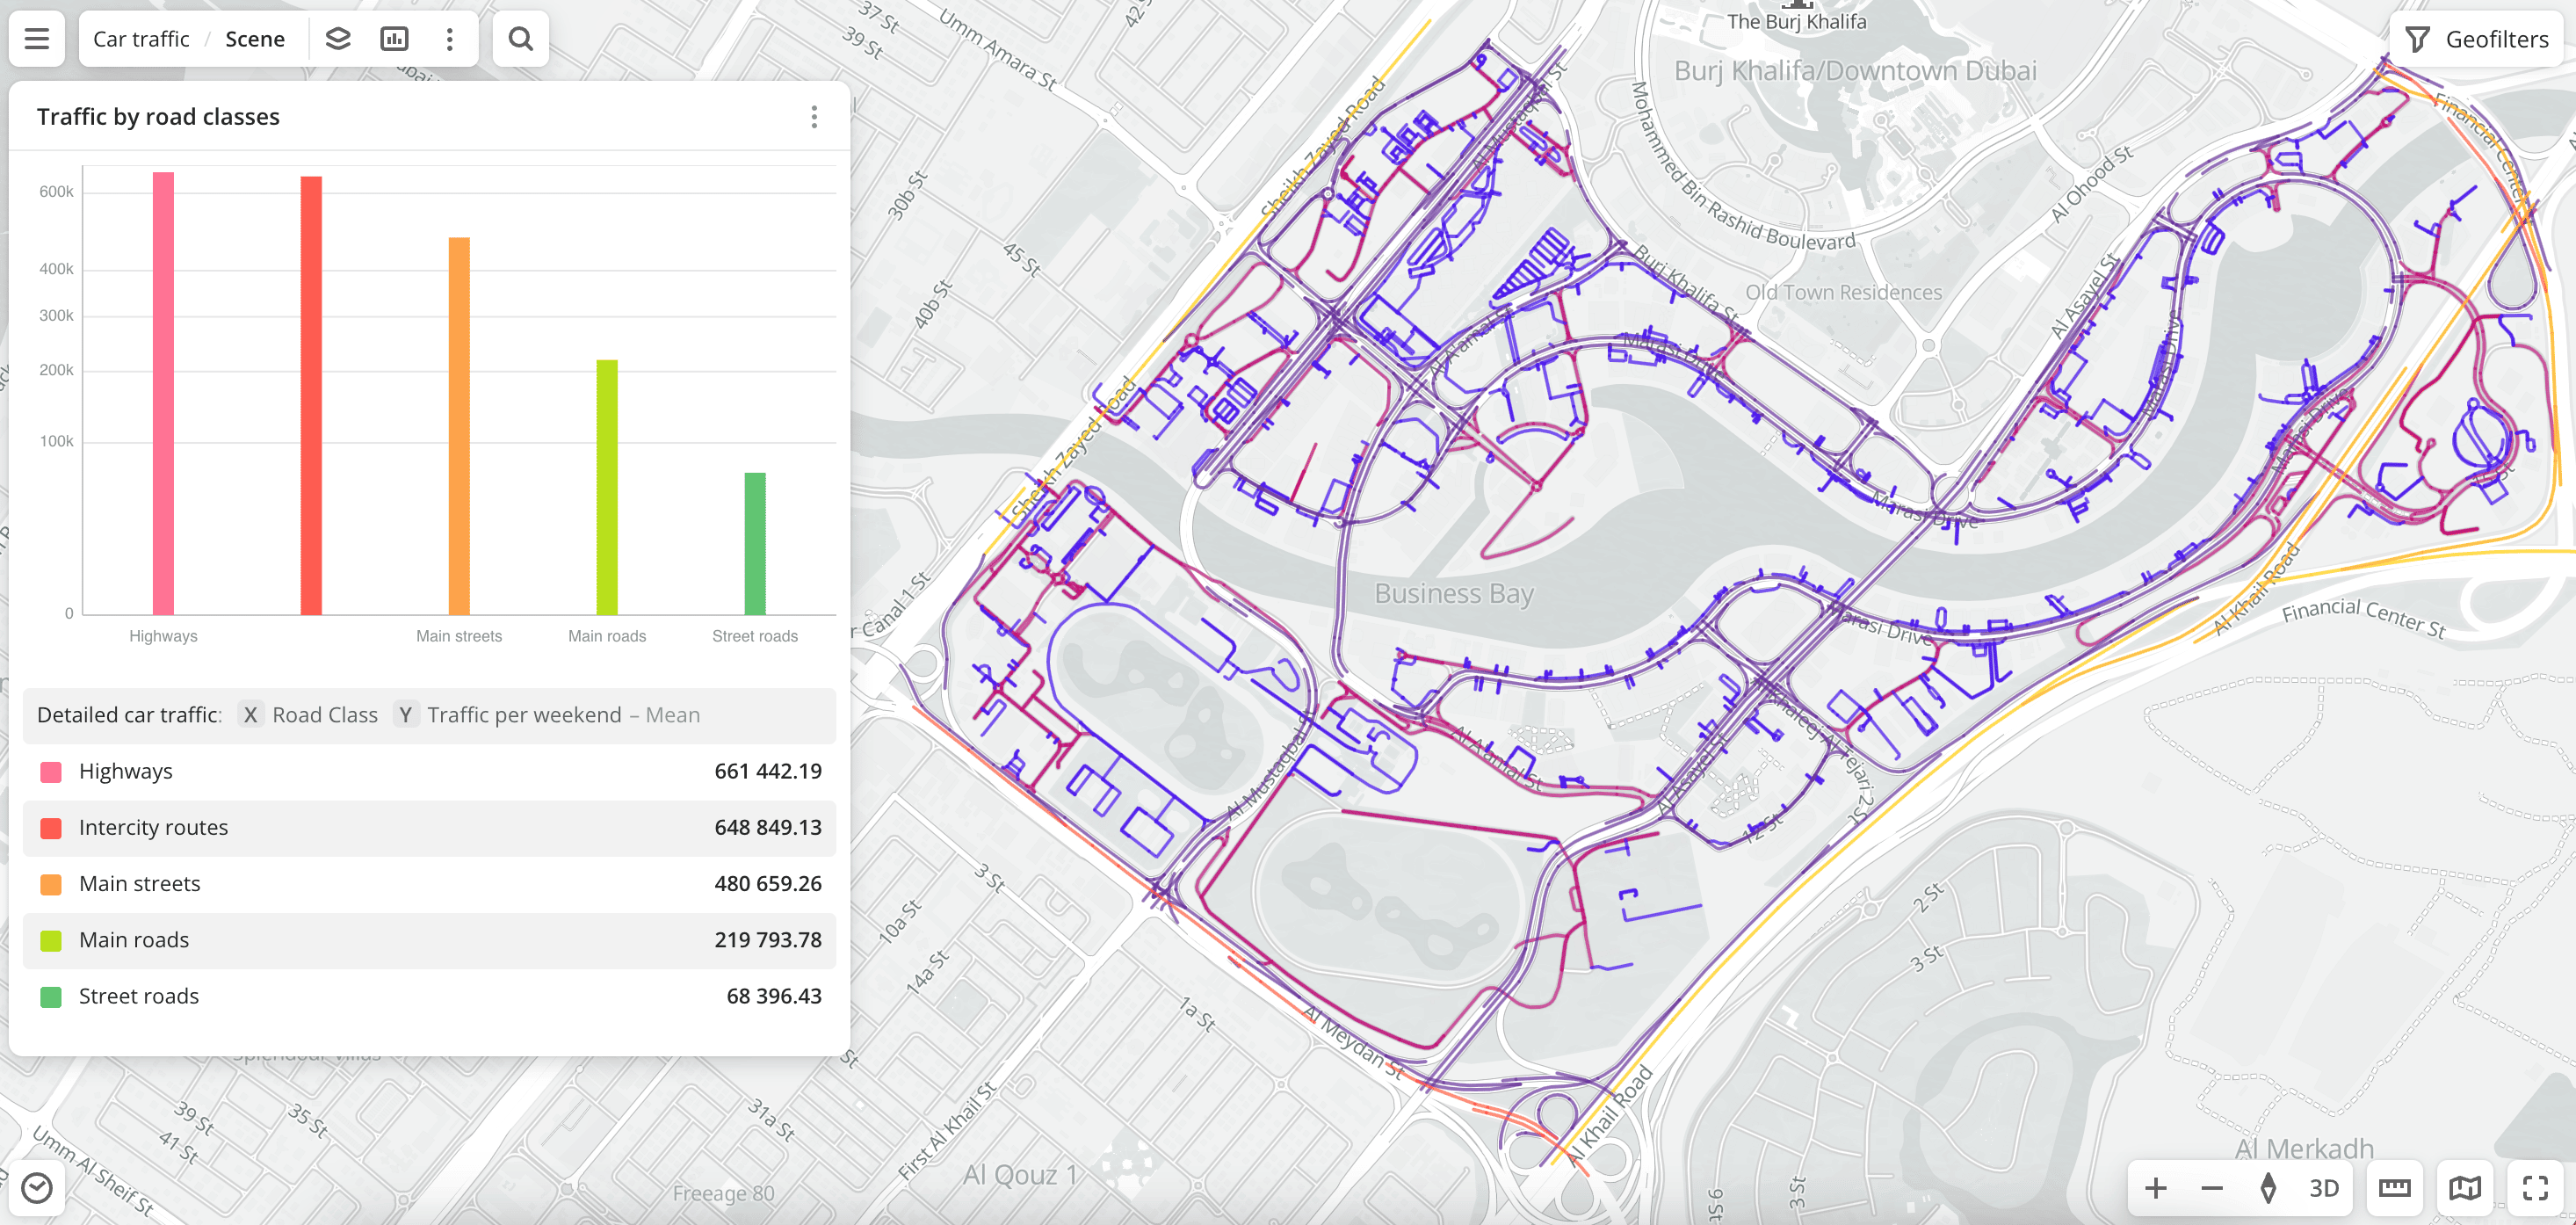
Road class: types of roads according to the OpenStreetMap (OSM) system classes. Available classes:
-
Private roads: roads inside residential blocks, minor roads in the private sector, and others. Corresponds to the 8th OSM class. -
Minimum significance roads: roads with minimal priority. Can have any surface: asphalt, dirt, gravel, and others. Corresponds to the 7th OSM class. -
Street roads: asphalt roads with 7 meters or fewer width, usually in the private sector and industrial zones. Corresponds to the 7th OSM class.Example: Lake Avenue street in Dubai.
-
Main roads: roads wider than 7 meters within populated areas; the only roads leading to a settlement; streets used by public transport. Corresponds to the 6th OSM class.Example: Al Gharbi street in Dubai.
-
Main streets: wide city streets, main transport arteries. Corresponds to the 4th and 5th OSM classes.Example: Financial Center street in Dubai.
-
Intercity routes: roads connecting large settlements and city streets leading to them that are not highways. Corresponds to the 3rd OSM class.Example: Tripoli street in Dubai.
-
Highways: roads of federal and regional significance (for example, in the UAE, markedEandD). Corresponds to the 2nd OSM class.Example: E66 - Dubai - Al Ain.
-
-
Traffic per weekday: amount of traffic per weekday.
-
Traffic per weekend: amount of traffic per one day of a weekend.
-
Traffic from ... to ... on weekdays: amount of traffic per one certain hour of a weekday. For example, the filter
Traffic from 1 a.m. to 2 a.m. on weekdayscontains data on traffic from 01:00 to 02:00 in the timezone of the selected territory. -
Traffic from ... to ... on weekends: amount of traffic per one certain hour of one day of a weekend. For example, the filter
Traffic from 1 a.m. to 2 a.m. on weekdayscontains data on traffic from 01:00 to 02:00 in the timezone of the selected territory.
To reset the parameter filter, click ![]() icon next to the filter name. To reset all parameter filters, click Reset filters at the bottom of the tab.
icon next to the filter name. To reset all parameter filters, click Reset filters at the bottom of the tab.
To hide the filter by territory, in the Geofilter settings dialog, click ![]() icon next to the geofilter name. To delete the geofilter, click
icon next to the geofilter name. To delete the geofilter, click ![]() icon next to its name. To delete all geofilters, click Clear filters.
icon next to its name. To delete all geofilters, click Clear filters.
Data visualization
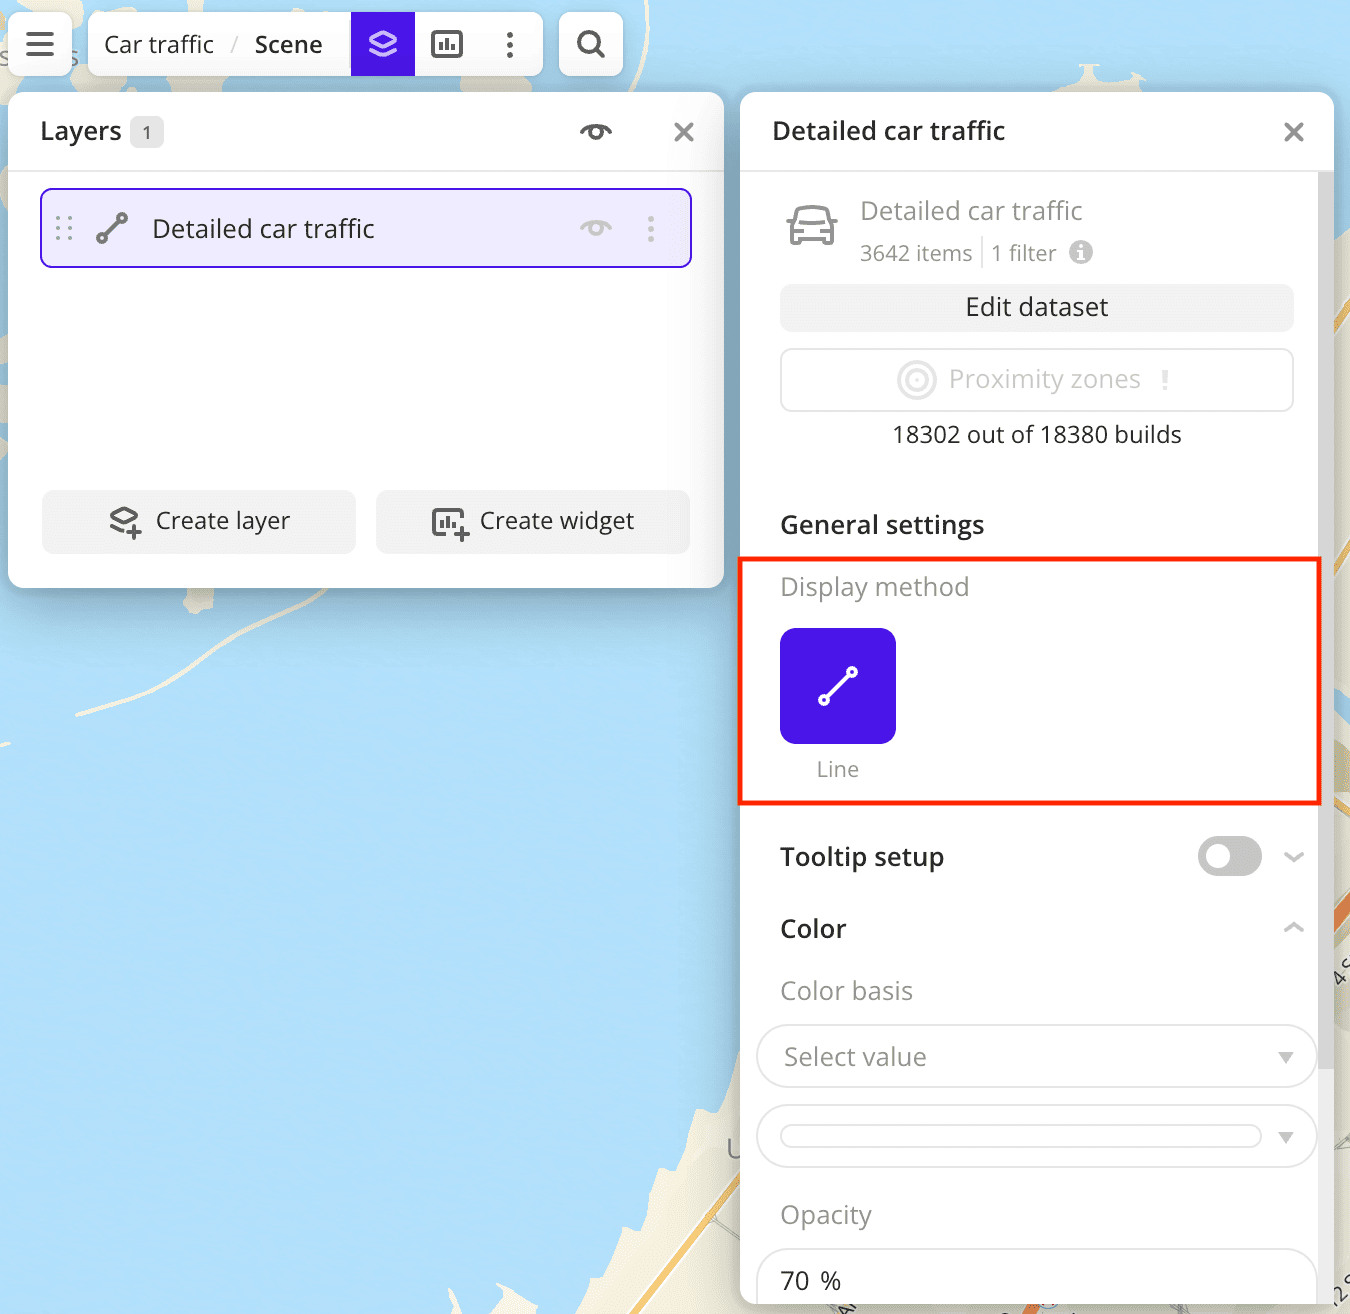
For the dataset, only the Line visualization method is available because the traffic information is tied to road segments.
After creating the layer, configure a basic data visualization:
-
Select the Line visualization method:
-
By default, the tooltip for this dataset displays more than 50 attributes. To configure a tooltip and reduce the number of attributes, enable the Tooltip setup option and select the basic data attributes:
Traffic per weekdayandTraffic per weekend: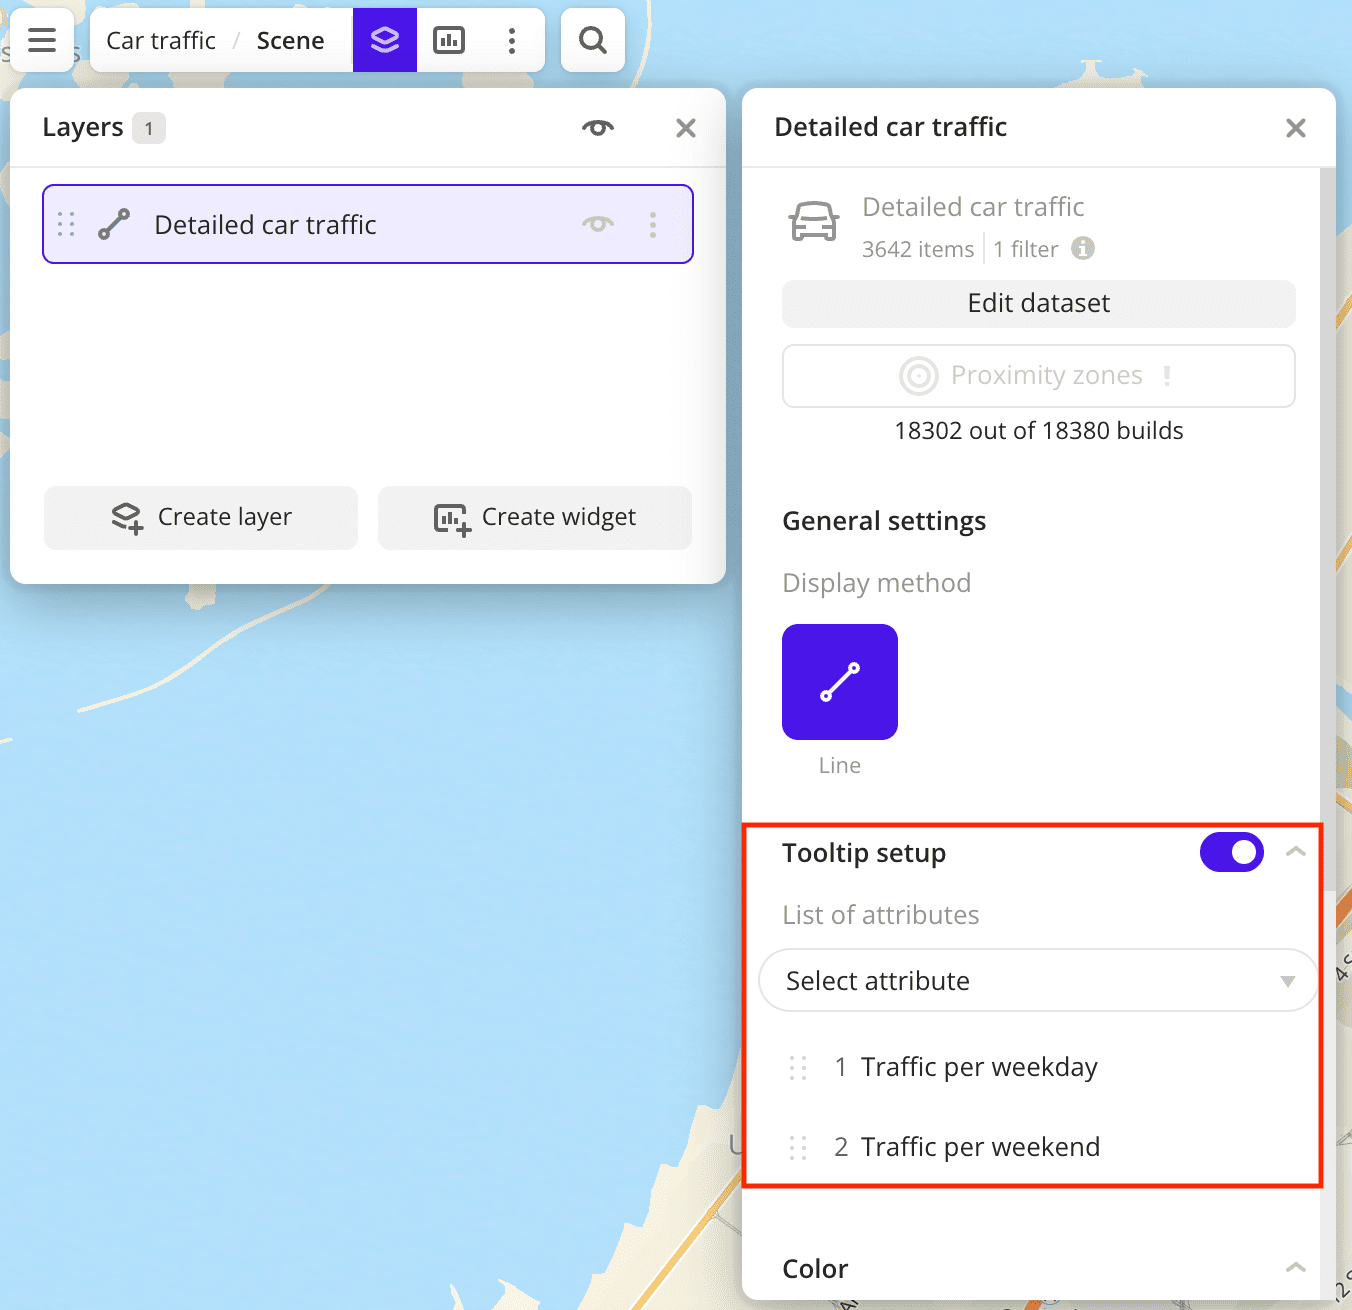
-
To analyze the road network, change the color of the lines on the map depending on the road class. In the Color basis field, select the
Road classattribute and specify the color scale: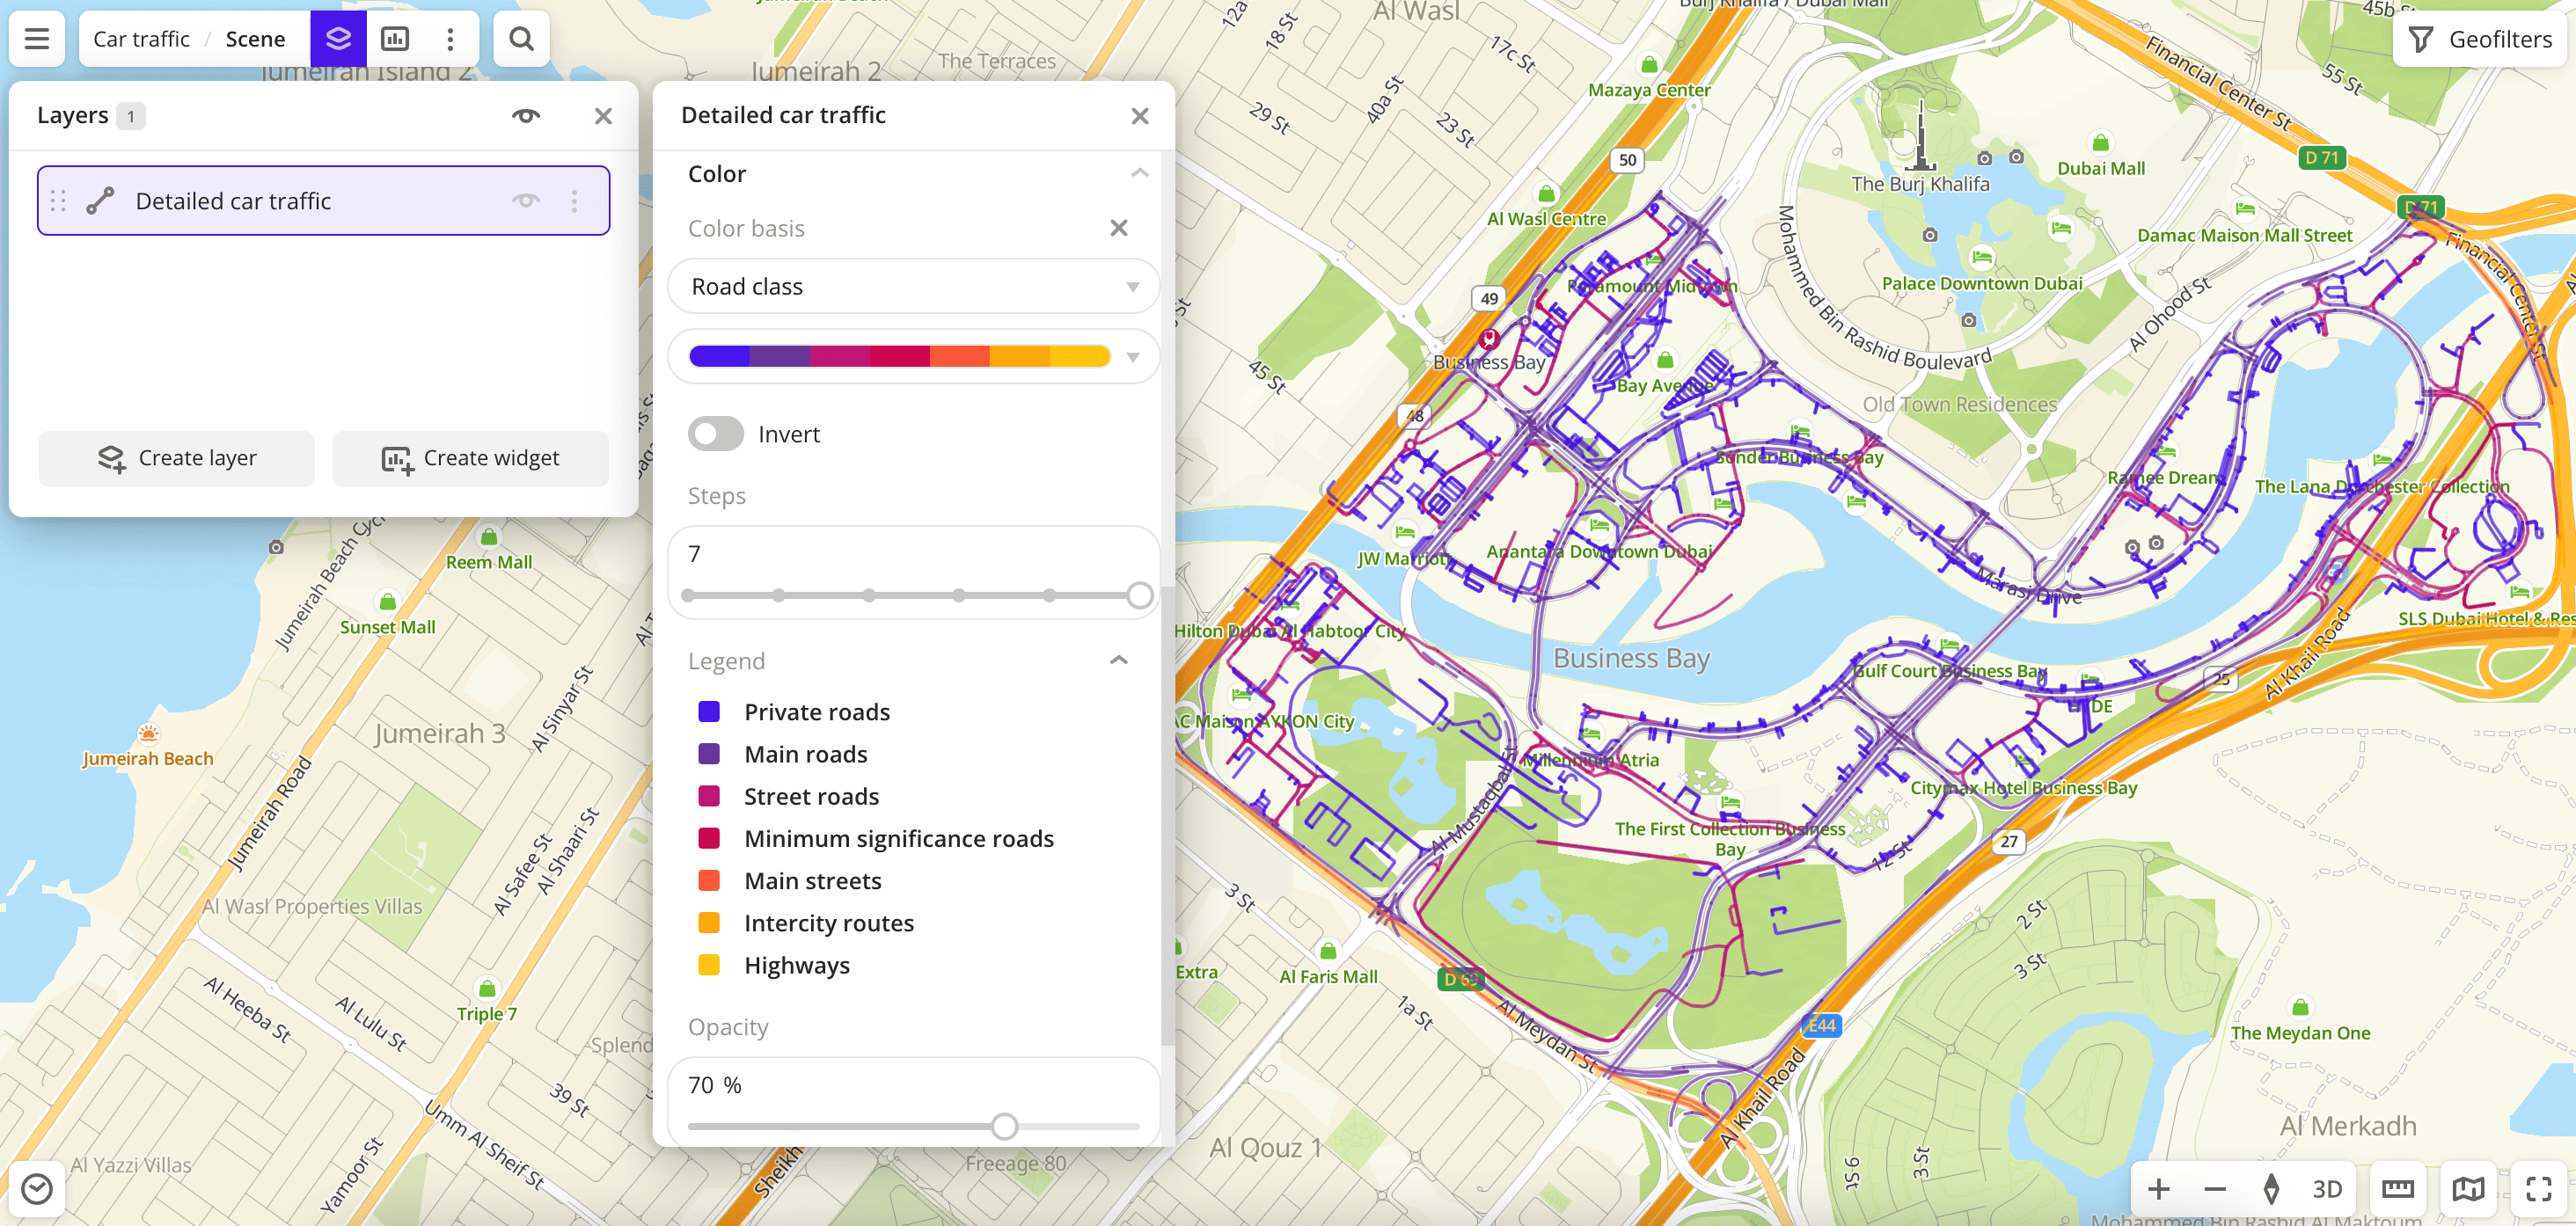
Data purchasing
You can purchase data separately as an export in the following formats:
- Table formats:
.csv.txt.json
- Formats for storing geographic data:
.shp(Shape).gpkg(GeoPackage).geojson(GeoJSON)
For more information about the price, available territories, and how to purchase data, fill out the form on urbi.ae.
What's next?
- Quick start.
- Get to know more about other Data categories.
- Get to know how to work with Data visualization.
- Get to know more about Layers, Dashboards, Scenes, and Widgets.
- Get to know prepared Analytics presets.