Filtering data on a dashboard
By default, dashboard scenes display all data from the samples that the layers in this scene are based on. When working with dashboards, you can apply additional filtering to data samples. For example, temporarily hide part of the data on the dashboard scene without changing the data sample.
You can filter data from the sample:
- by territories: through geofilters
- by data attributes: through graphs in widgets
- by date and time: through the Timeline widget
Important
When you filter data on a dashboard, data samples in the layers remain the same. Only the number of objects on the scene changes: on the map, in the legend, and in all widgets except a text widget and a timeline.
If you need to modify the data sample, use the Modifying data sample instruction.
Filtering through geofilters
Geofilters allow you to display data only for the selected territories on the dashboard scene without editing the sample. Apply geofilters to display data only for specified territories on the map, in the legend, and in other widgets.
-
Go to the Dashboards tab.
-
Open the required dashboard.
-
Open a scene using the arrows
 and
and  . If there is only one scene in the dashboard, it opens automatically when you open the dashboard.
 -
To change territories for data displaying, use one of the following ways:
-
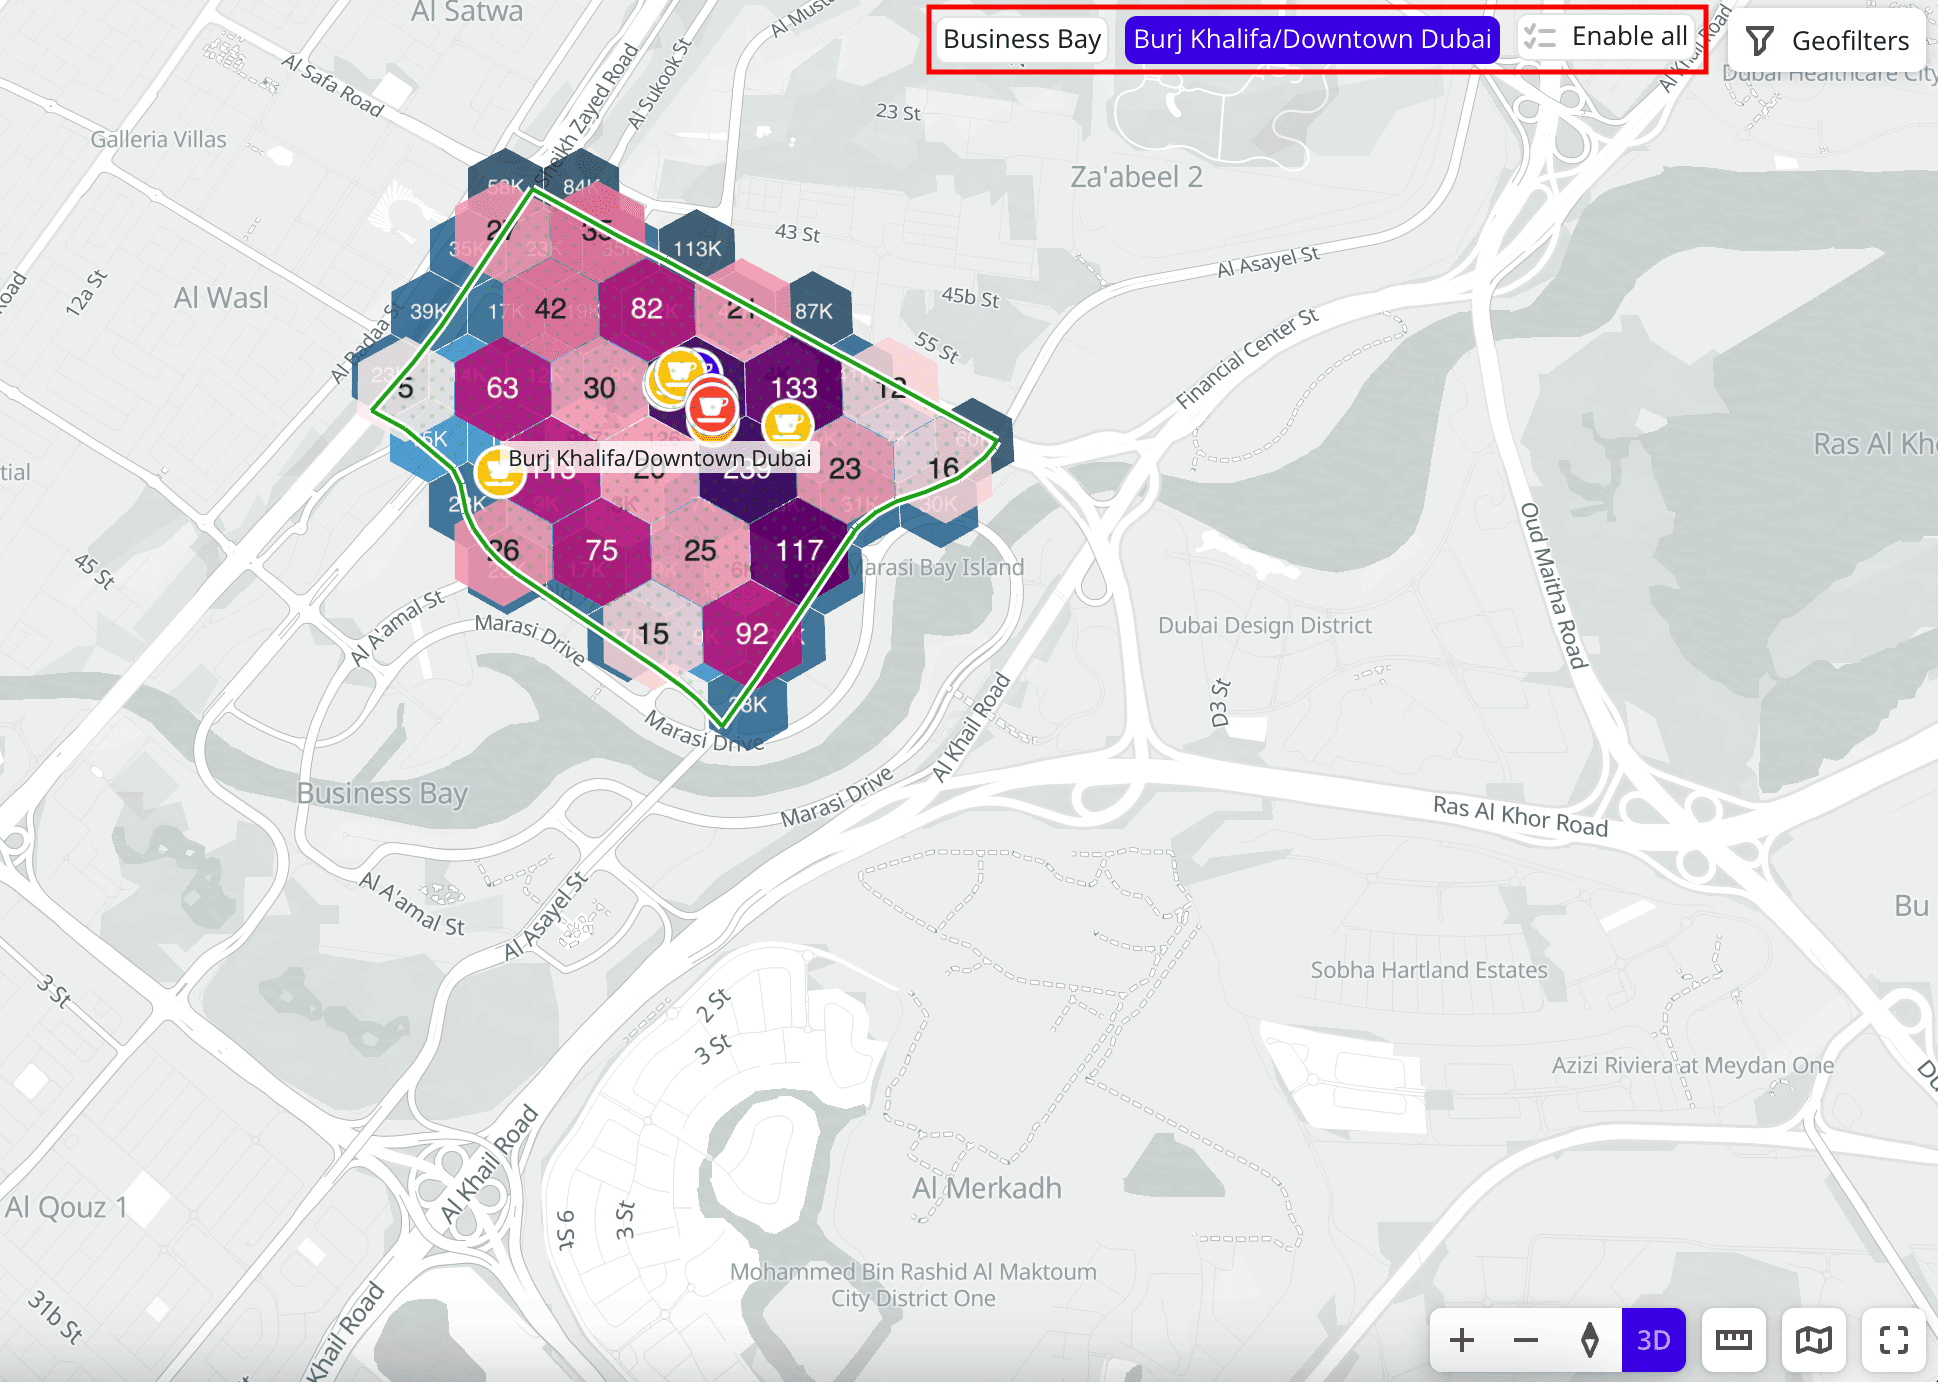
In the upper right corner of the dashboard scene, click on the names of the territories which data you need to hide:
-
Click Geofilters and specify the required territories in the Geofilter settings dialog. To hide the filter by territory, click
 icon next to the geofilter name. To delete the geofilter, click
  icon next to its name. To delete all geofilters, click Clear filters:
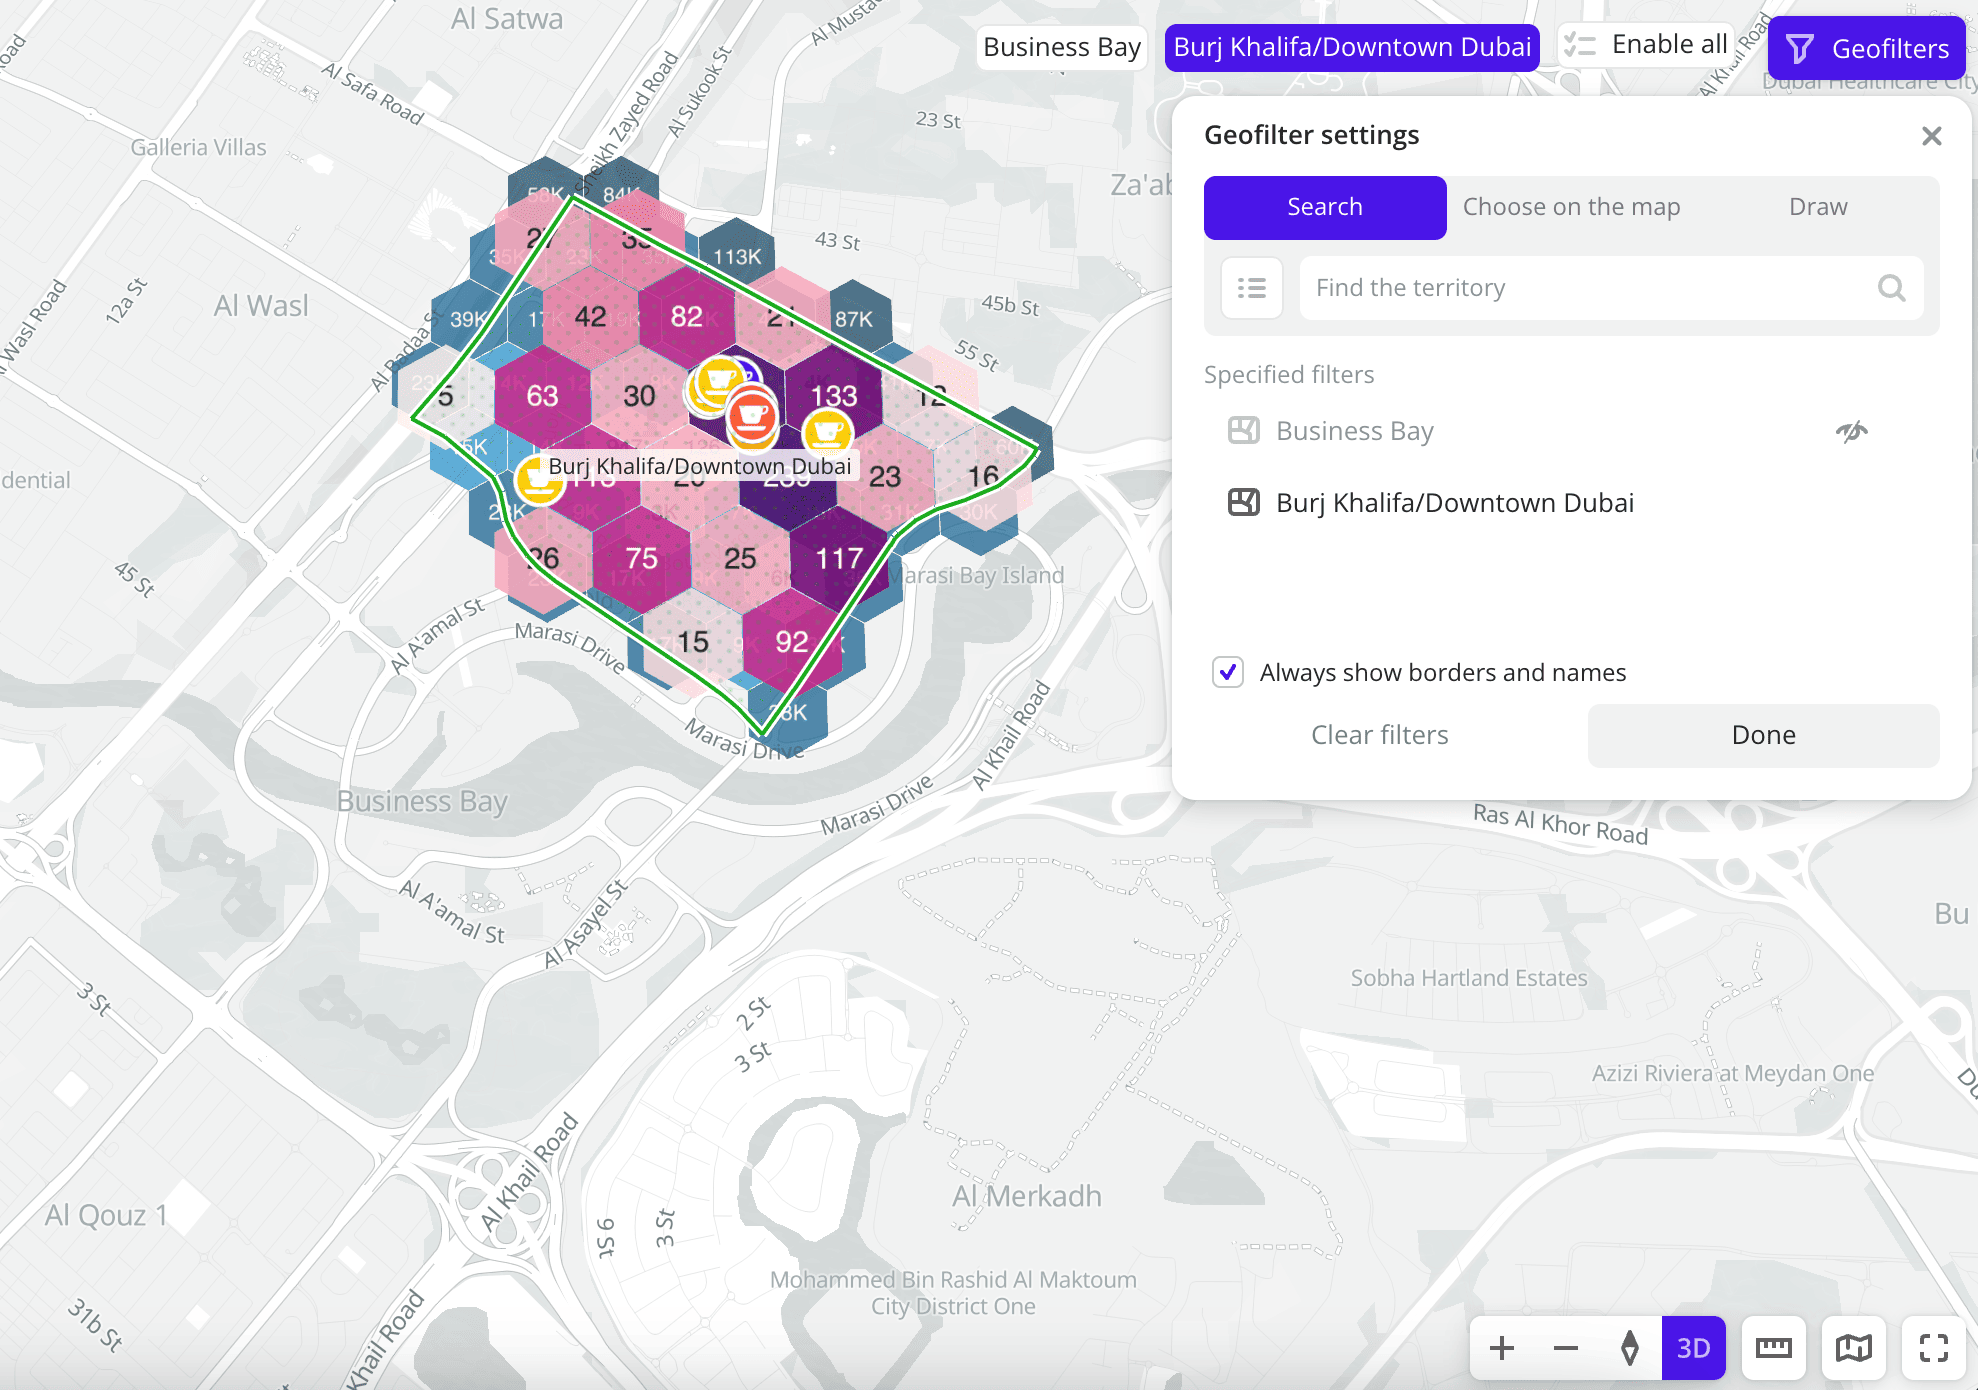
-
As a result, only data for the selected territory is left on the map and in the widgets.
Before applying the geofilter:
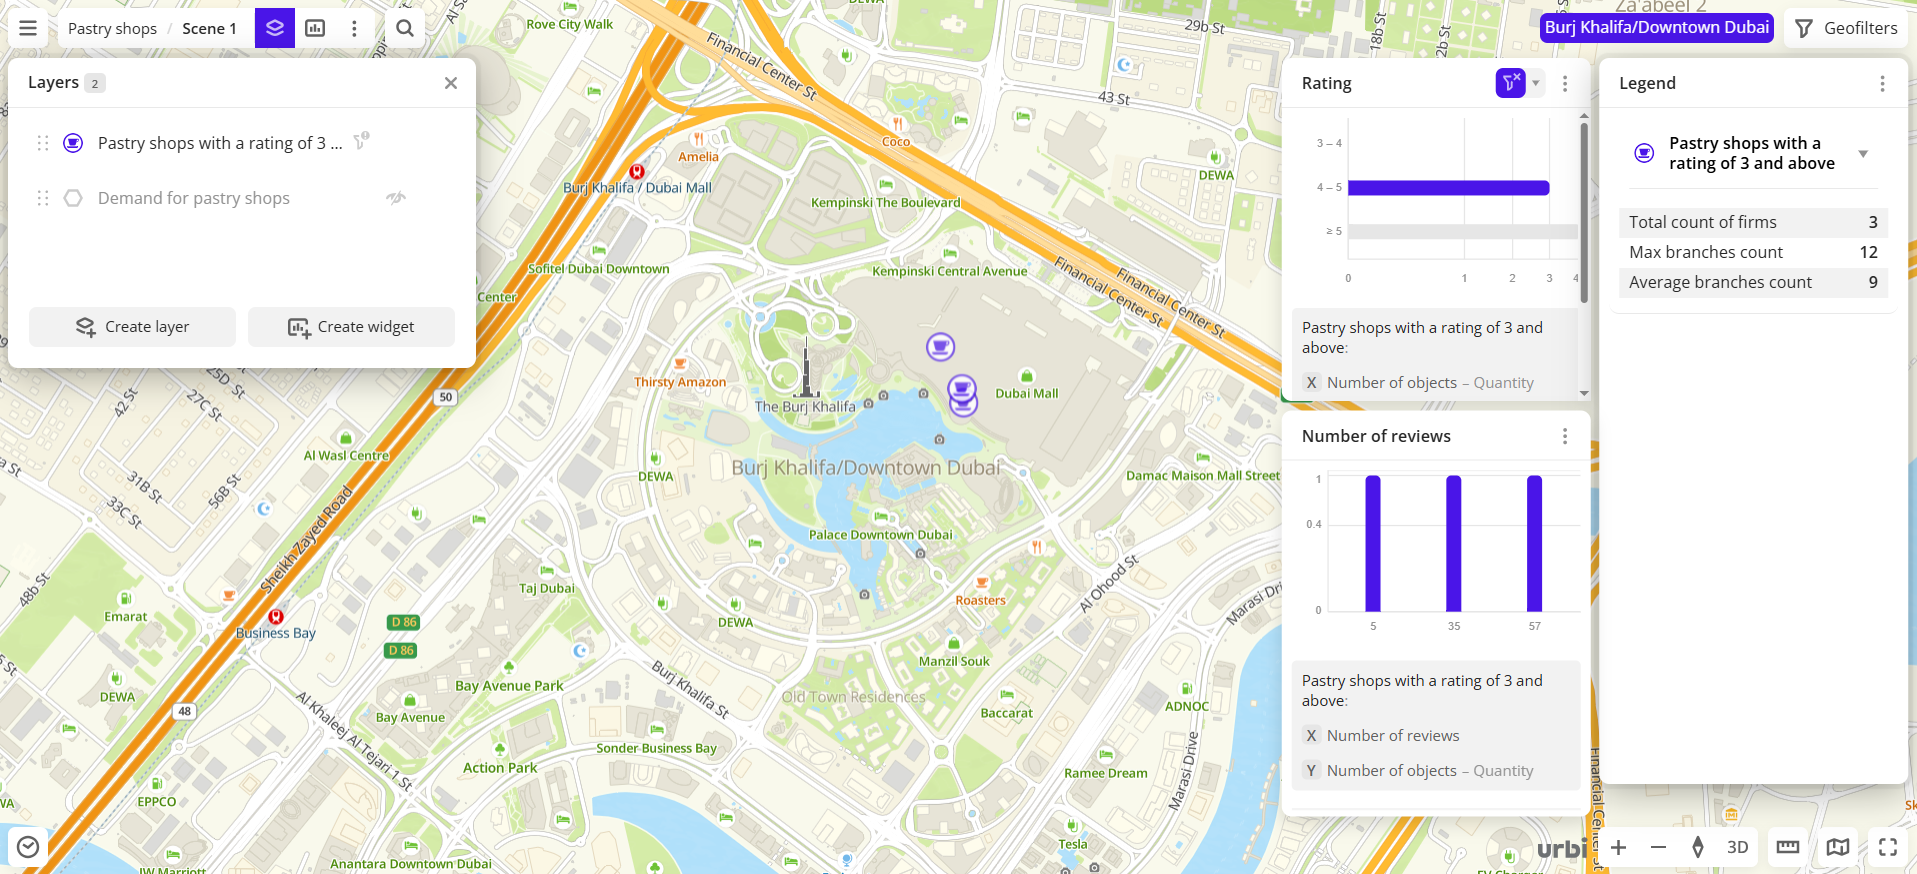
After applying the geofilter:
Filtering through widgets
You can interact with widgets to display only the data of your interest on the dashboard scene without editing the sample. Click one or multiple graph components (bars, columns, or slices) to display only relevant values on the map, in the legend, and in other widgets.
Filtering is available for the following widget types:
You can apply filtering to both one layer and multiple layers (if the samples were created from one dataset).
Filtering for one layer
For example, to apply the filtering for one layer to the dashboard scene created during Quick start:
-
Go to the Dashboards tab.
-
Open the required dashboard.
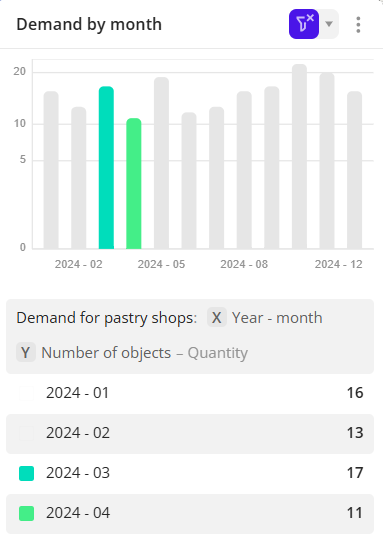
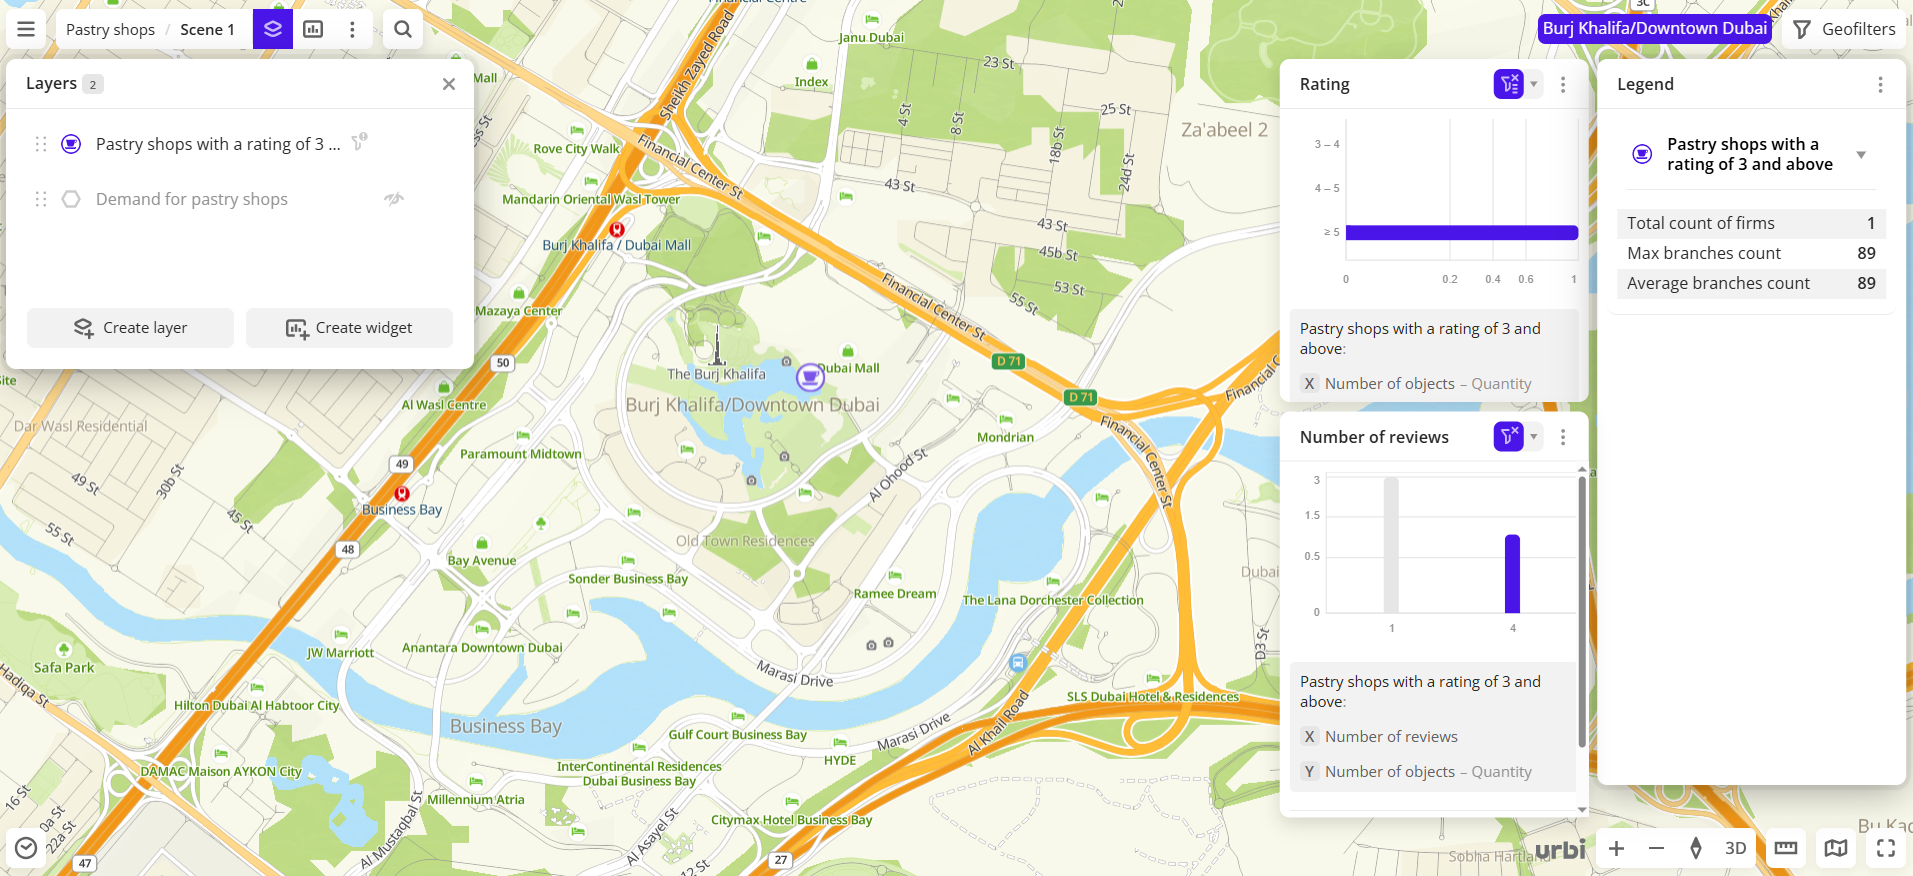
On the scene, the
Demand for pastry shopslayer is hidden for convenience.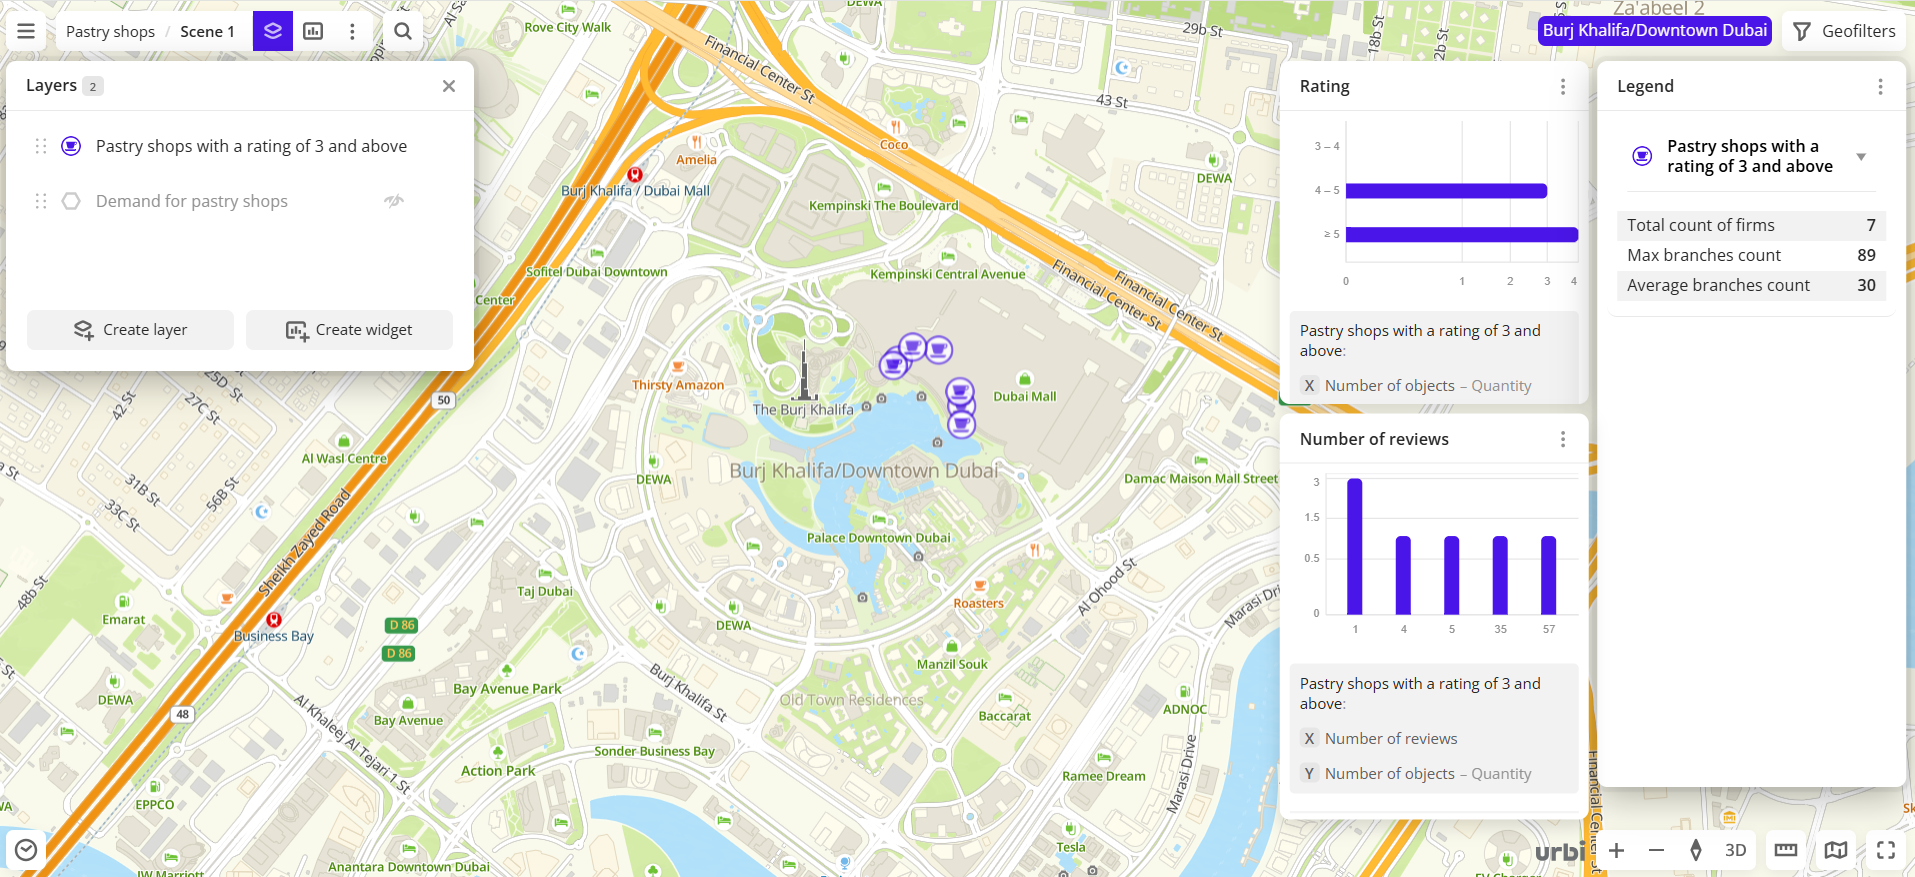
-
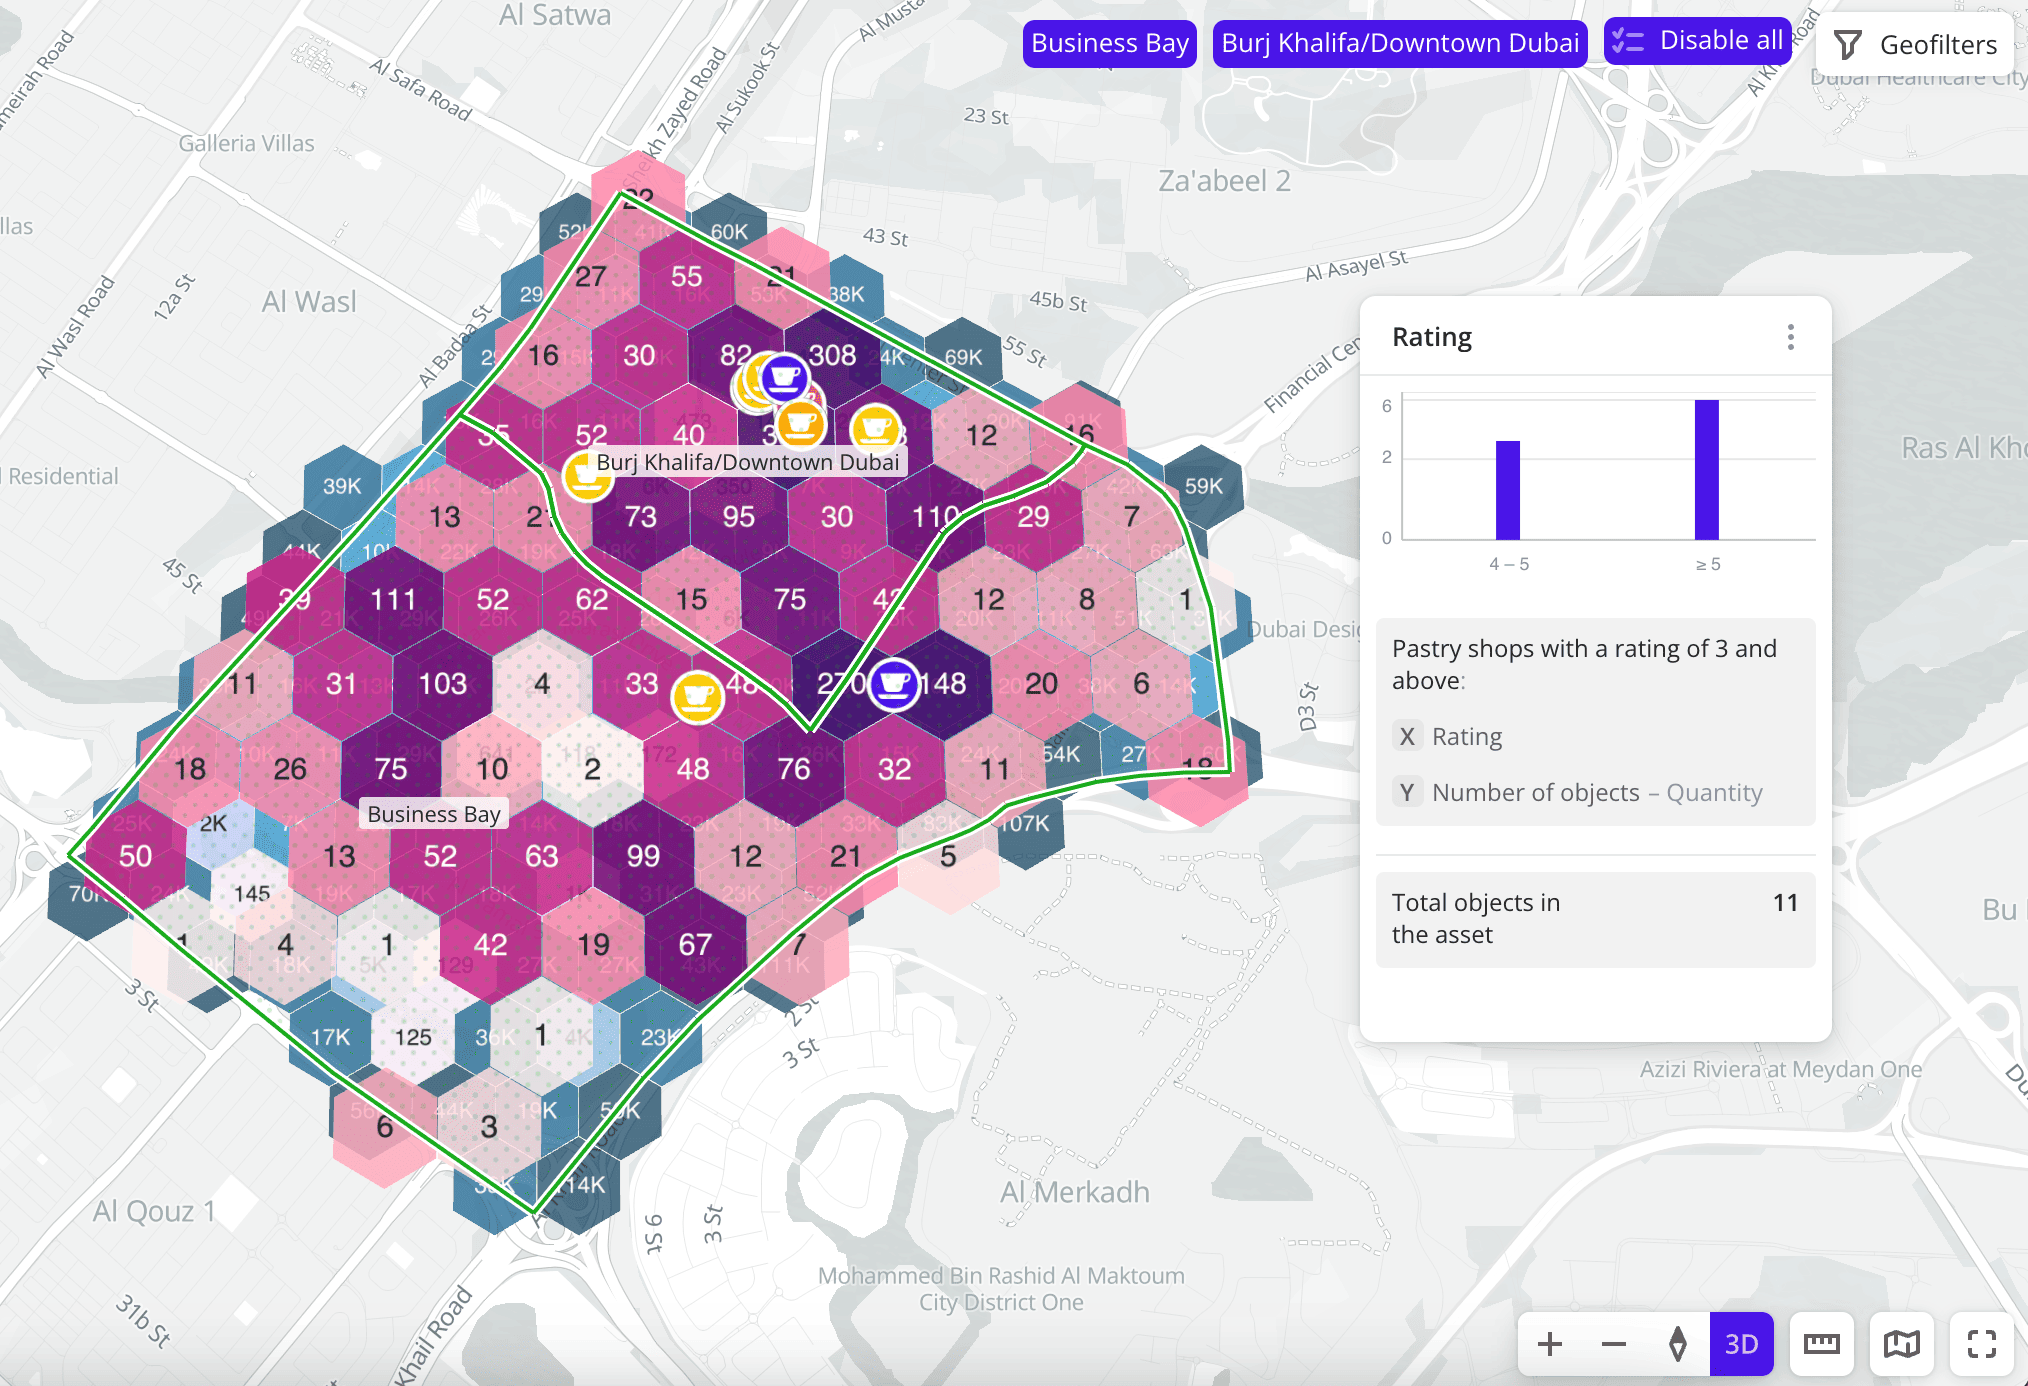
In the previously created Rating widget for the
Pastry shops with a rating of 3 and abovelayer, click the 4-5 rating range (second line on the chart). As a result:- Only the pastry shops with a rating between 4 and 5 are left on the map.
- Data in other widgets created from the same layer is updated. The Legend and the Number of reviews widgets display only the data for pastry shops with a rating between 4 and 5.
- In the layers list,
 icon appears next to the layer with the applied filter.
If the current dashboard scene contains widgets created from other layers, the filter does not affect them.
-
To remove the filter, click
 icon on the corresponding widget or click the selected range.
Filtering for multiple layers
If the dashboard scene contains multiple layers which samples are created from the same dataset, you can apply a filter to all of them. For example, to apply the filtering for multiple layers on the dashboard scene created during Quick start:
-
Go to the Dashboards tab.
-
Open the required dashboard.
-
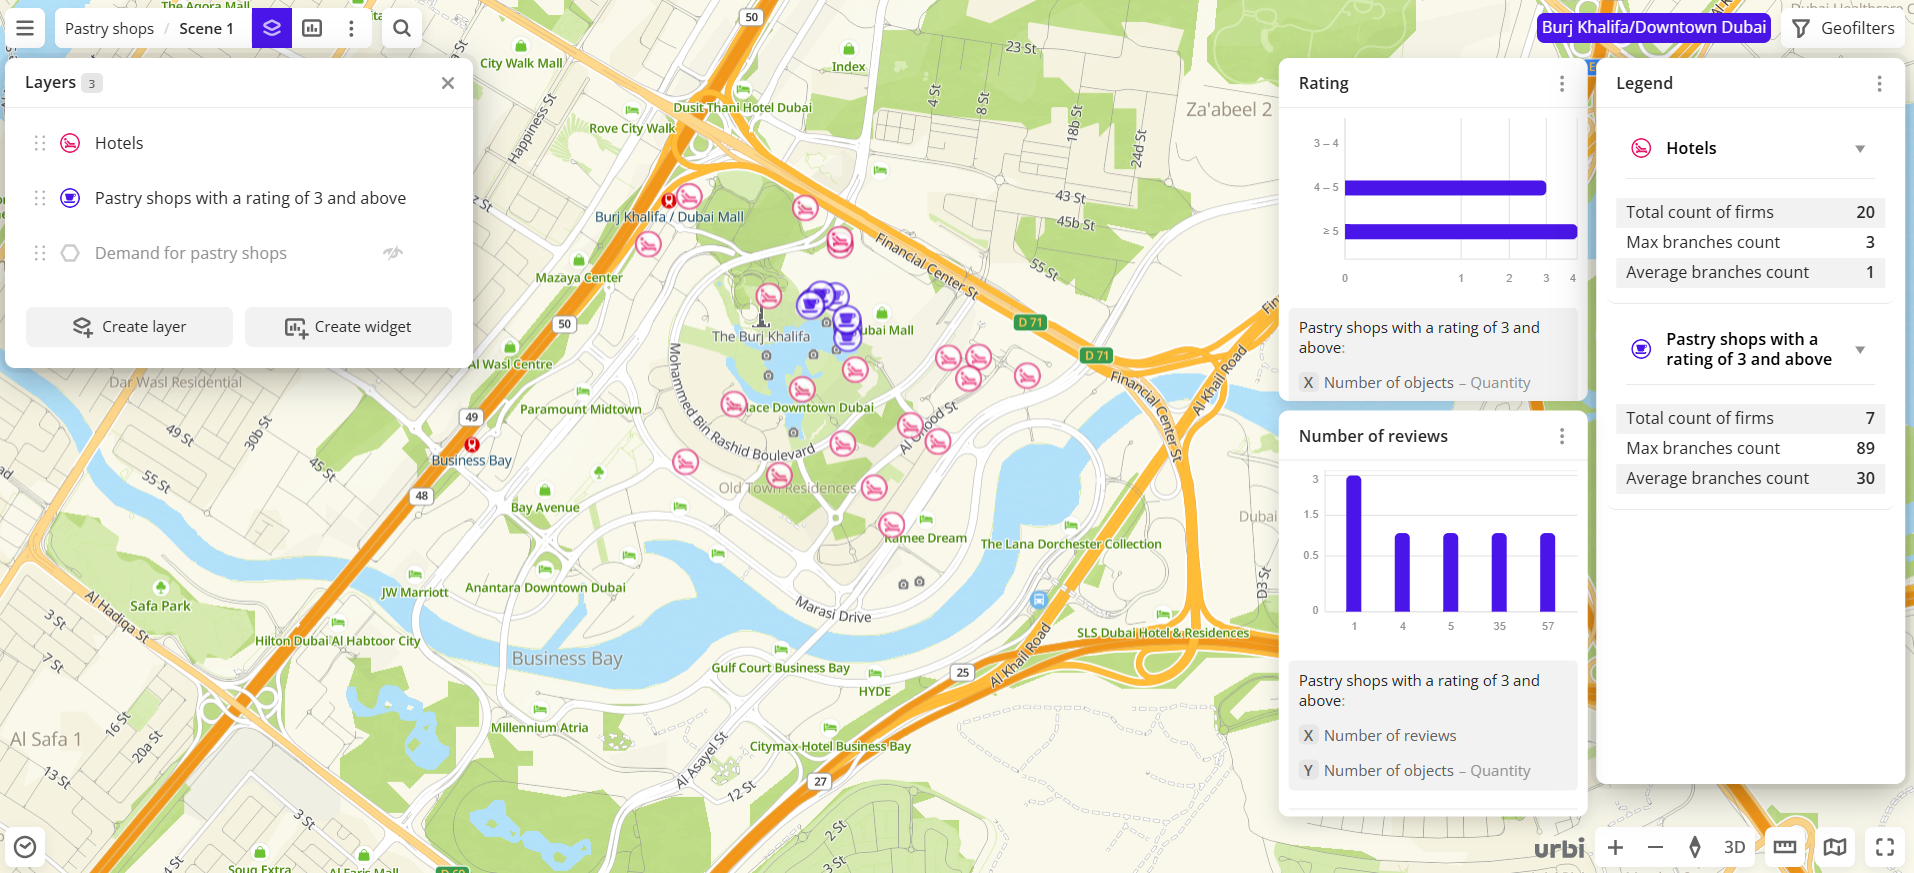
Create a new layer from the same dataset as the
Pastry shops with a rating of 3 and abovelayer. For example, a layer with Dubai downtown hotels:- Create a layer from the Firms dataset.
- In the Geofilter settings dialog, select
Burj Khalifa/Downtown Dubaiand click Done. - On the Filters tab, click Select categories. Then select Tourism / Leisure → Hotels and click Apply.
Now two layers with firms are displayed on the dashboard scene.
-
In the previously created Rating widget, click the 4-5 rating range (second line on the chart).
By default, the filter is applied only to the
Pastry shops with a rating of 3 and abovelayer, which it was created from.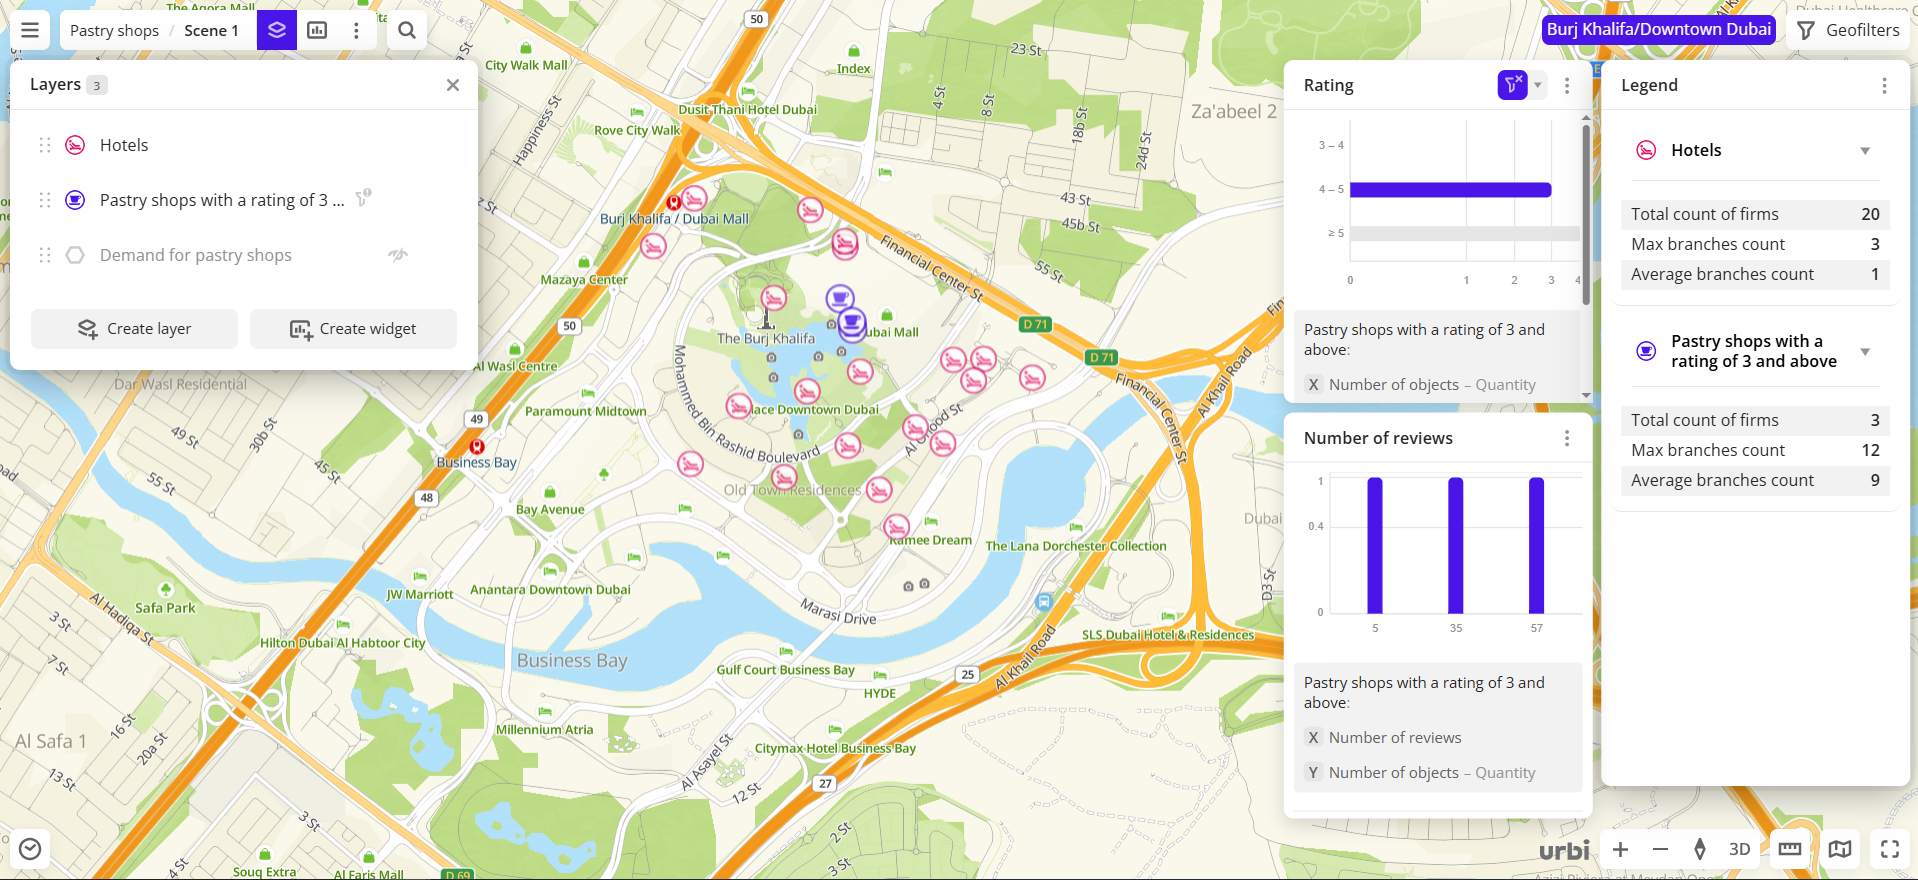
-
In the same widget, open the drop-down list next to
icon and select Apply to all layers.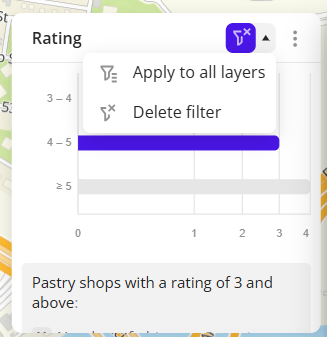
As a result:
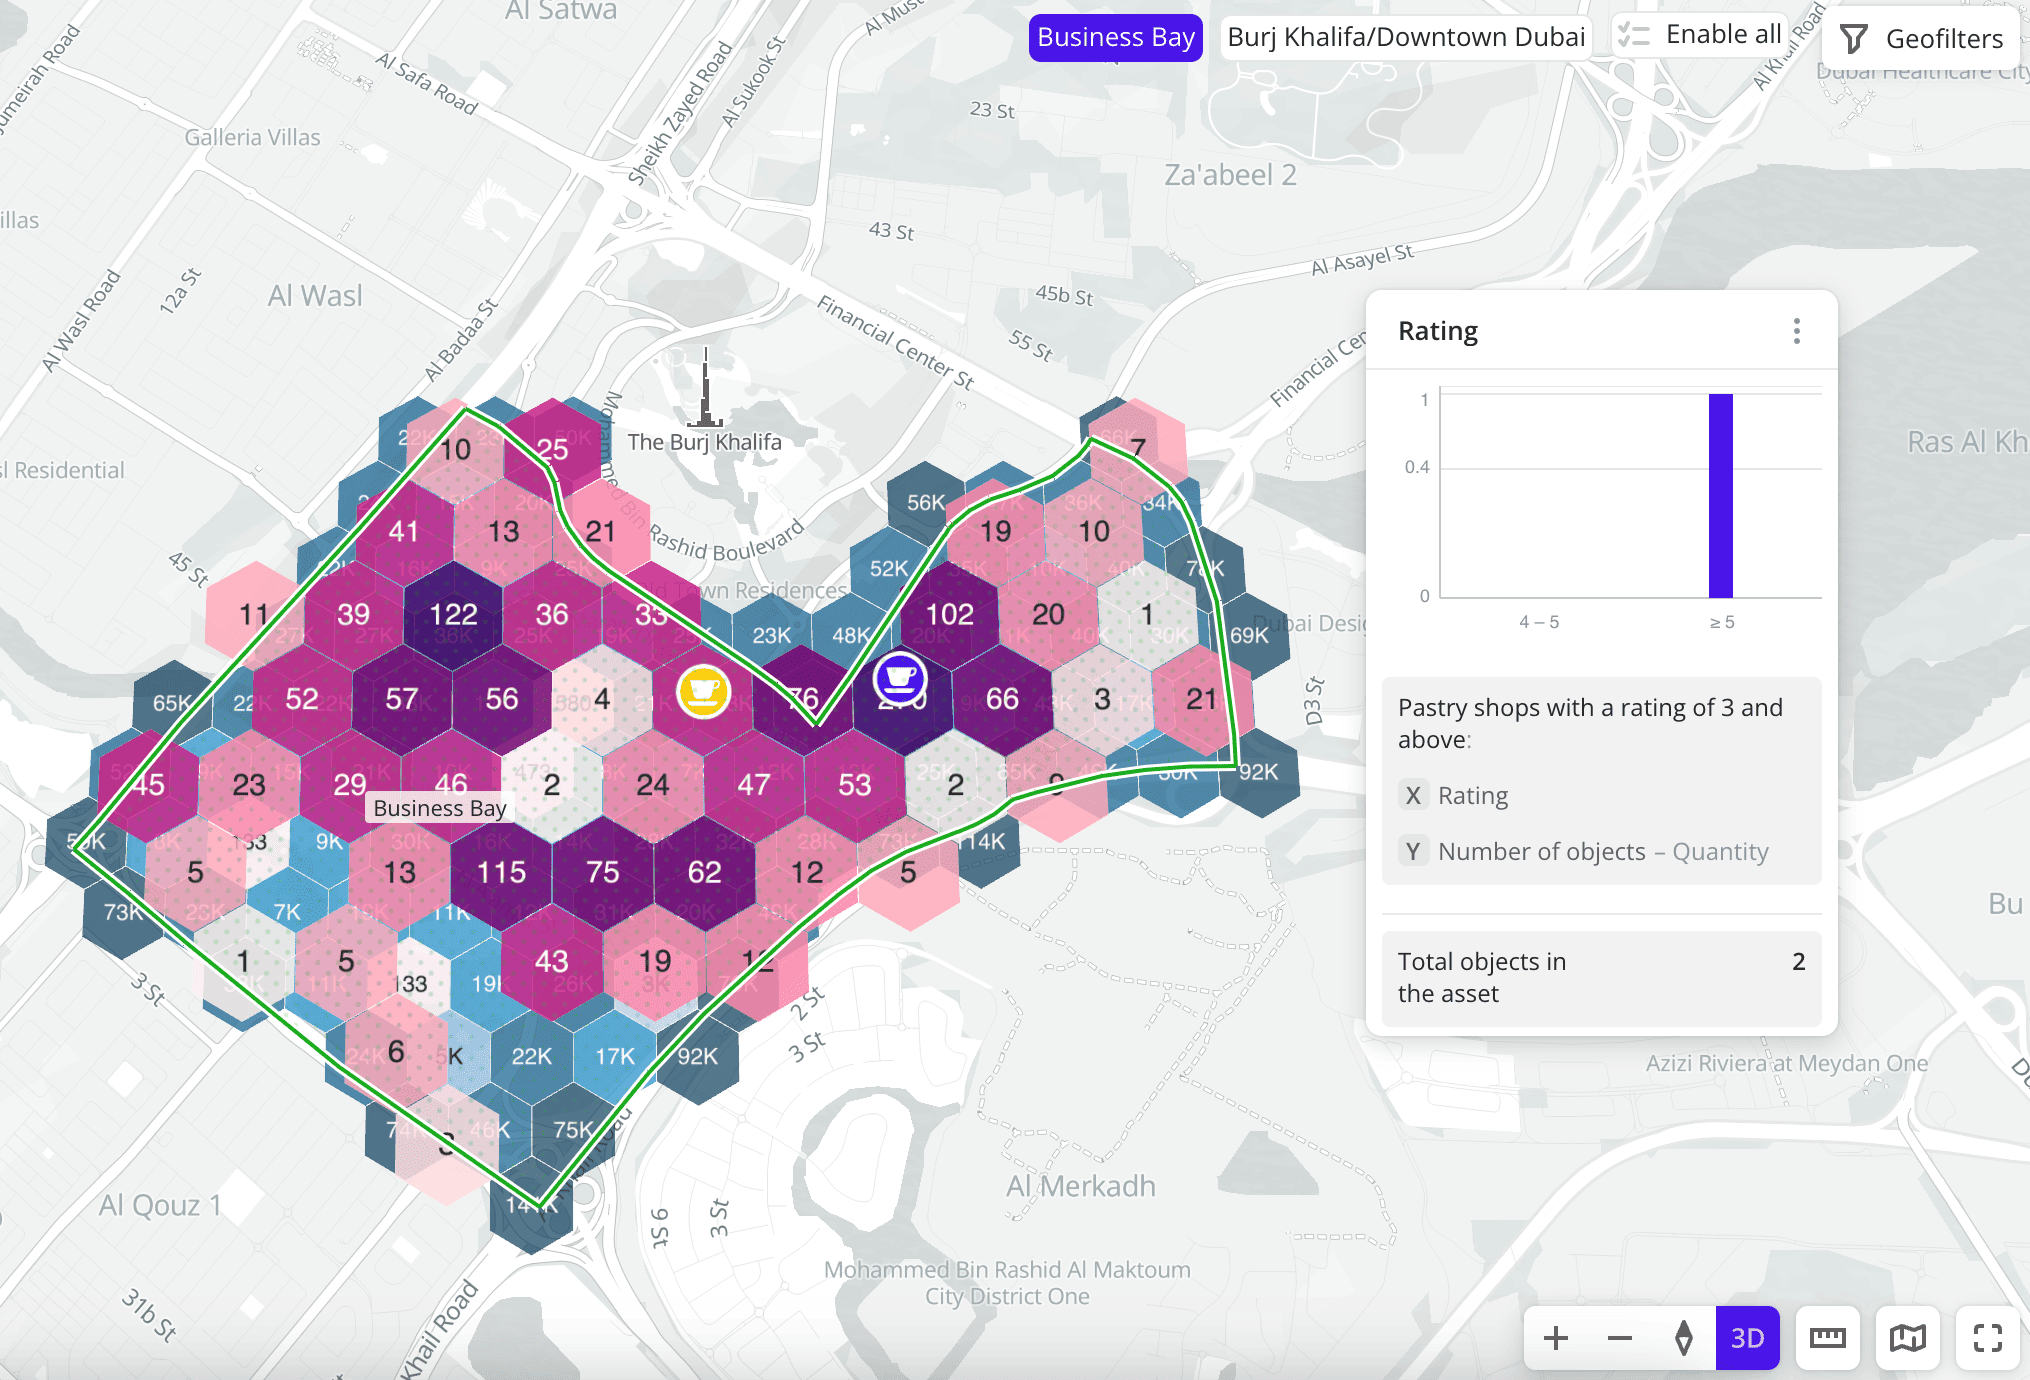
- Only pastry shops and hotels of the Dubai downtown with a rating between 4 and 5 are left on the map.
- Data in other widgets from layers created from the same dataset is updated. The Legend and the Number of reviews widgets display only the data for pastry shops and hotels with a rating between 4 and 5.
- In the layers list, icon appears next to the layers with the applied filter.
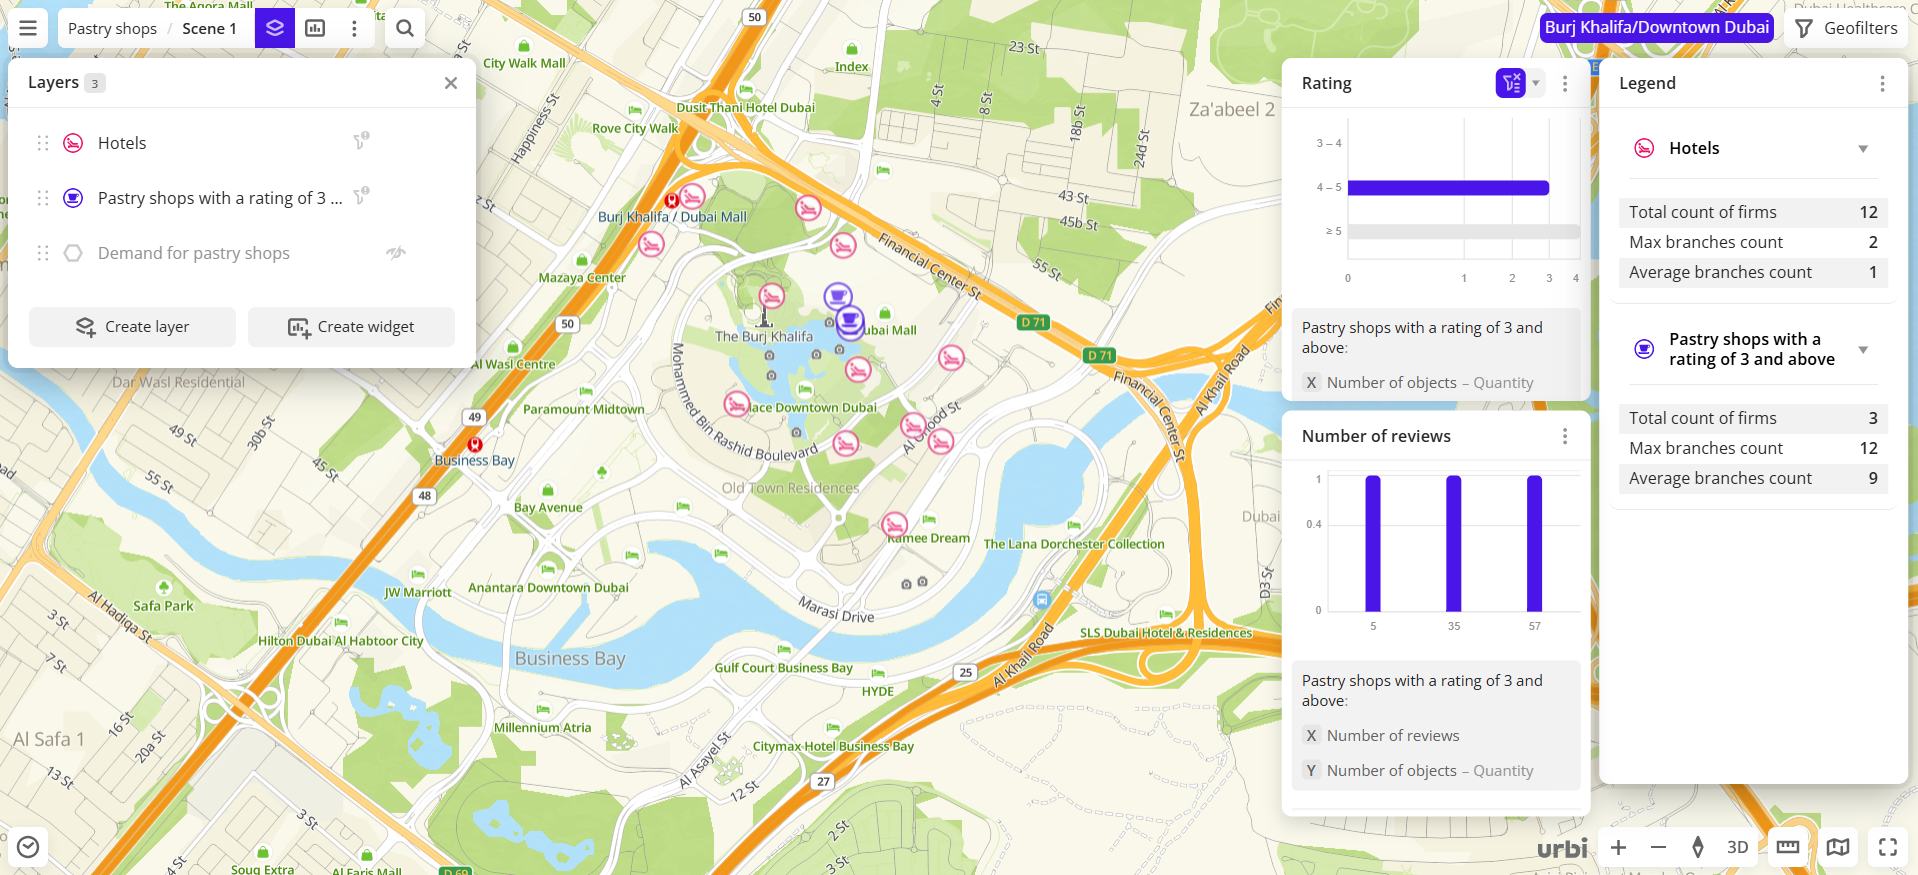
The filter is not applied to the layers created from other datasets because the set of attributes is different.
-
To apply the filter only to the source layer, open the drop-down list next to
icon again and select Source layer only.
Combining filtering conditions
-
You can select more than one chart component. In this case, filtering conditions are combined by the logical
ORoperator. For example, if you select two columns (4 and 5) in the Number of reviews widget, only the pastry shops that meet any of these conditions (with 4 or 5 reviews) are left on the map and in other widgets.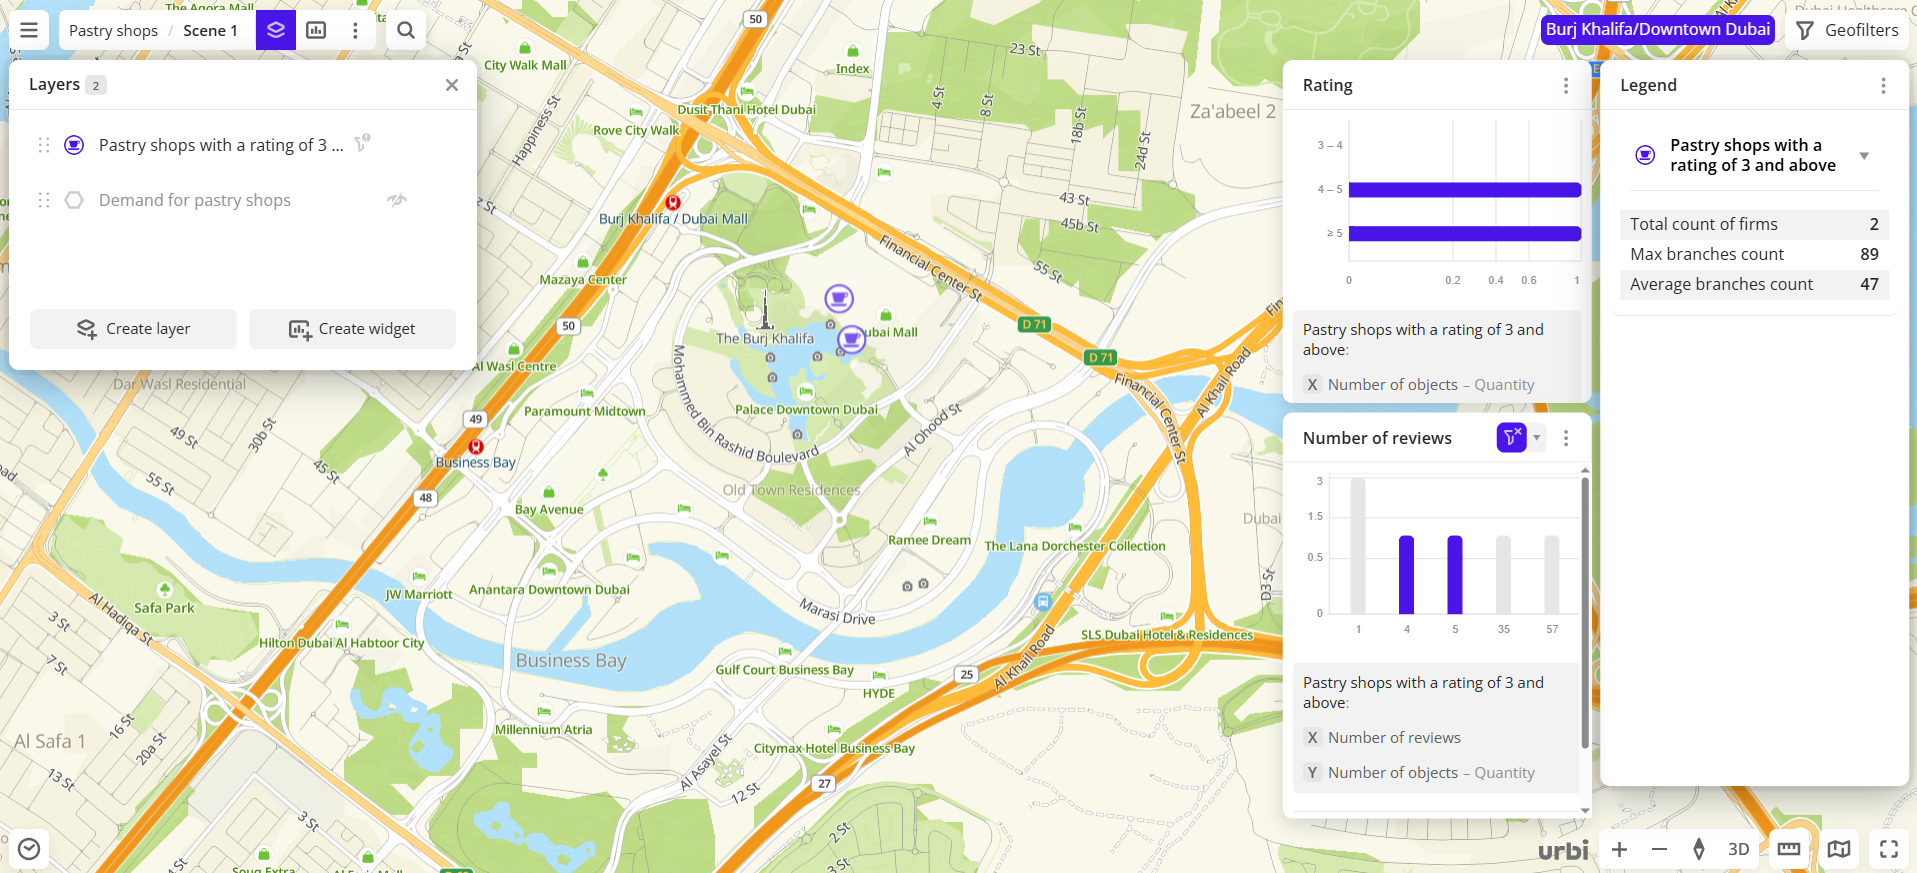
-
You can filter data through multiple widgets at the same time. In this case, filtering conditions are combined by the logical
ANDoperator. For example, if you select 4 reviews in the Number of reviews widget and the ≥5 rating range in the Rating widget, only the pastry shops that meet both of these conditions (with 4 reviews and ≥5 rating) are left on the map and in other widgets.If widgets belong to different layers, see more details in the Filtering for multiple layers section.
Filtering via a timeline
If you uploaded a data file that contains an attribute of the Date type, you can filter the data from the sample by this attribute using the Timeline widget. The dashboard scene displays data for the selected time period.
See the Timeline instruction for more details.
What's next?
- Quick start.
- Get to know how to work with Data visualization.
- Get to know more about Layers, Dashboards, Scenes, and Widgets.
- Get to know prepared Analytics presets.