Tourist potential
The Tourist potential data category provides information about the number of tourists (unique Urbi users from other regions) with selected filters. It helps to evaluate locations for opening a business in popular tourist zones and research places for tourism development. The data is updated every month.
Data availability
- On-Cloud (Urbi Pro service): data is available upon request and is not available in the demo tariff. To start working with the data, change the tariff and request access to the dataset.
- On-Premise (installation of the service in a private environment): data is not available.
Overview
To get started:
- Go to the Main or Data tab.
- Select the Tourist potential data category.
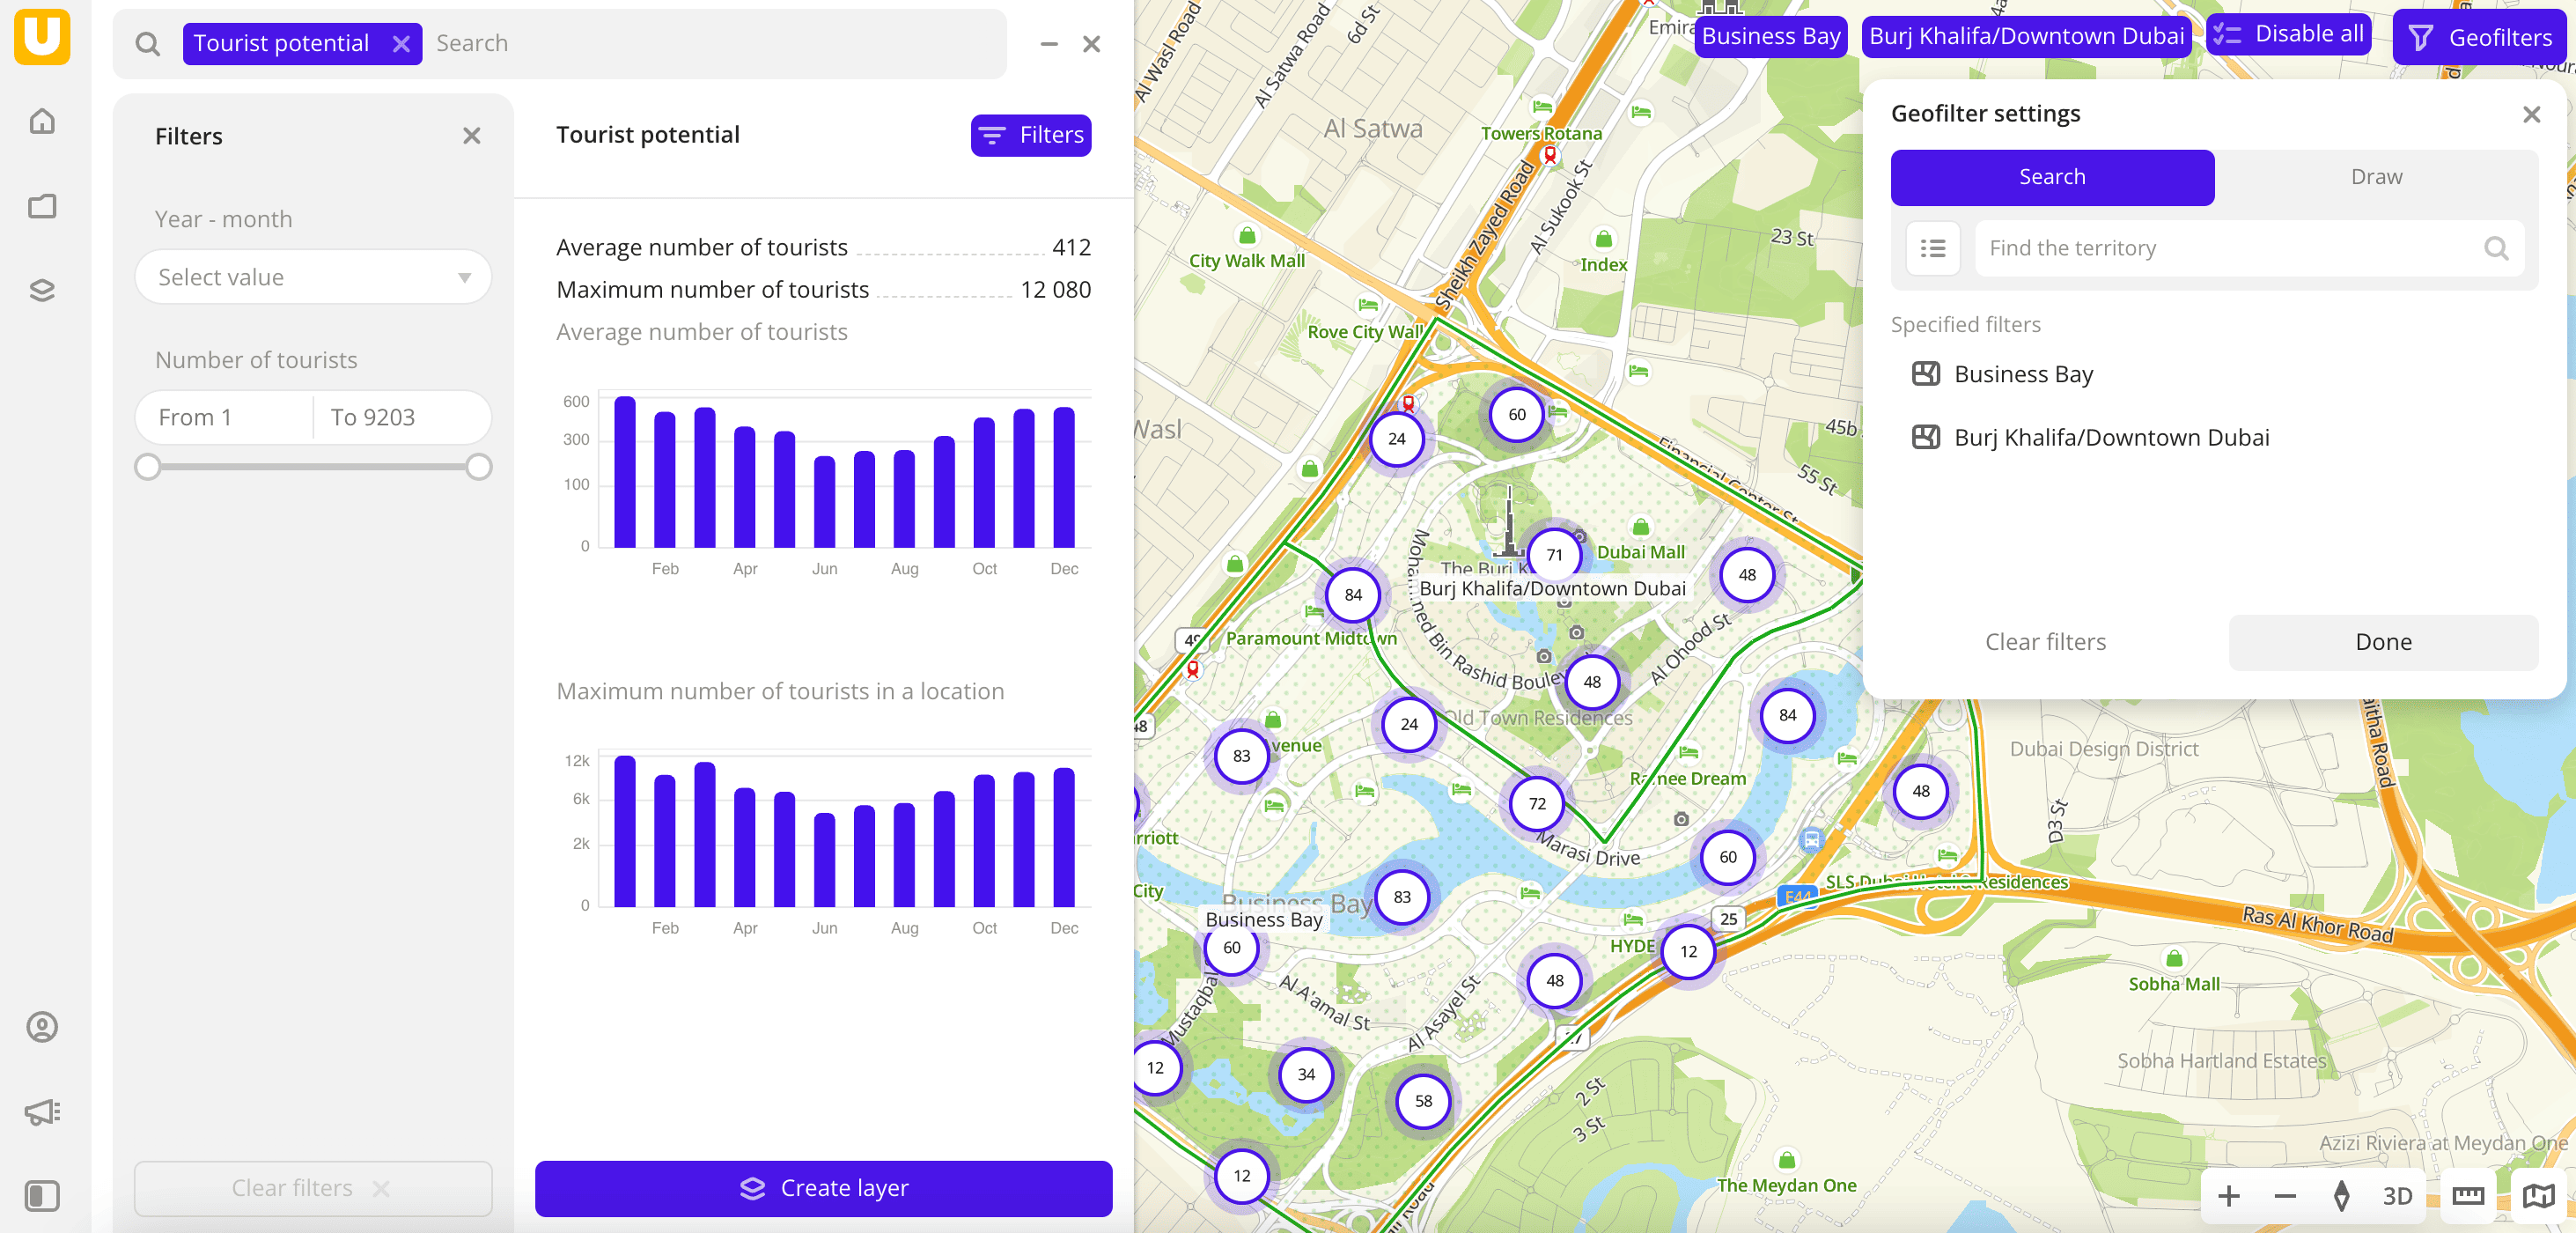
- In the Geofilter settings dialog, select up to 50 territories for which the data sample is created. You can use standard and custom territories and also build polygons, proximity zones, and circles on the map. For more information, see the Geofilters section. After you select the territories, click Done.
- On the Filters tab, set the remaining filters if necessary.
The data is displayed on the map as centroid points: the centers of the object geometries. The following filtering results are available:
- Average count of tourists in the specified territory.
- Maximum count of tourists in the specified territory.
- Chart with distribution of average count of tourists in the specified territory by month. Displayed if data for more than one month is selected.
- Chart with distribution of maximum count of tourists in the specified territory by month. Displayed if data for more than one month is selected.
To save this data sample and customize its visualization (e.g., as a heatmap), click Create layer.
Filters
For the Tourist potential category, the following filters are available:
- Year-month: year and month to display data. You can select multiple options.
- Number of tourists: count of tourists in the specified territory for the selected time period.
To reset the parameter filter, click ![]() icon next to the filter name. To reset all parameter filters, click Reset filters at the bottom of the tab.
icon next to the filter name. To reset all parameter filters, click Reset filters at the bottom of the tab.
To hide the filter by territory, in the Geofilter settings dialog, click ![]() icon next to the geofilter name. To delete the geofilter, click
icon next to the geofilter name. To delete the geofilter, click ![]() icon next to its name. To delete all geofilters, click Clear filters.
icon next to its name. To delete all geofilters, click Clear filters.
What's next?
- Quick start.
- Get to know more about other Data categories.
- Get to know how to work with Data visualization.
- Get to know more about Layers, Dashboards, Scenes, and Widgets.
- Get to know prepared Analytics presets.