Buildings
The Buildings dataset provides information about all types of buildings from the Urbi directory.
Usage scenarios
The Buildings dataset helps to solve different problems:
- Selecting locations for opening points of sale or offices. It helps to find objects with high commercial potential for rent or purchase using filters by purpose, number of floors, working population, and living population.
- Renovating old housing stock. It allows you to identify outdated buildings suitable for purchase or renovation using filters by year of construction and small area.
- Analyzing district development. It helps to determine the density of development and the ratio of residential and commercial buildings using filters by number of floors, area, year of construction, and purpose.
How is the data collected?
Buildings are added to the map based on their contours and heights obtained through remote sensing. Information about buildings is regularly updated and verified by Urbi specialists during field visits or remotely.
Important
Buildings with a total area of less than 4 m² are not included in the dataset: piers, sports and decorative structures, parking lots, etc.
Data update and history
- Update frequency: data is updated once a week.
- History: historical data is not available. You can only view the latest updated data.
Available territories
Data is available for the following countries:
- Oman
- Qatar
- Saudi Arabia
- UAE
The data may not be available throughout the entire country, but only in populated areas where Urbi is present. To check data availability, use geofilters or contact the technical support.
Data availability
- On-Cloud (Urbi Pro service): data is available upon request and is not available in the demo tariff. To start working with the data, change the tariff and request access to the dataset.
- On-Premise (installation of the service in a private environment): data is available.
Getting started
- Go to the Main or Data tab.
- Select the Buildings dataset.
- In the Geofilter settings dialog, select up to 50 territories for which the data sample is created. You can use standard and custom territories and also build polygons, proximity zones, and circles on the map. For more information, see the Geofilters section. After you select the territories, click Done.
- On the Filters tab, set the remaining filters if necessary.
The data is displayed on the map as building contours and as centroid points at lower map zoom levels: the centers of the object geometries. Filtering results are available on two tabs:
-
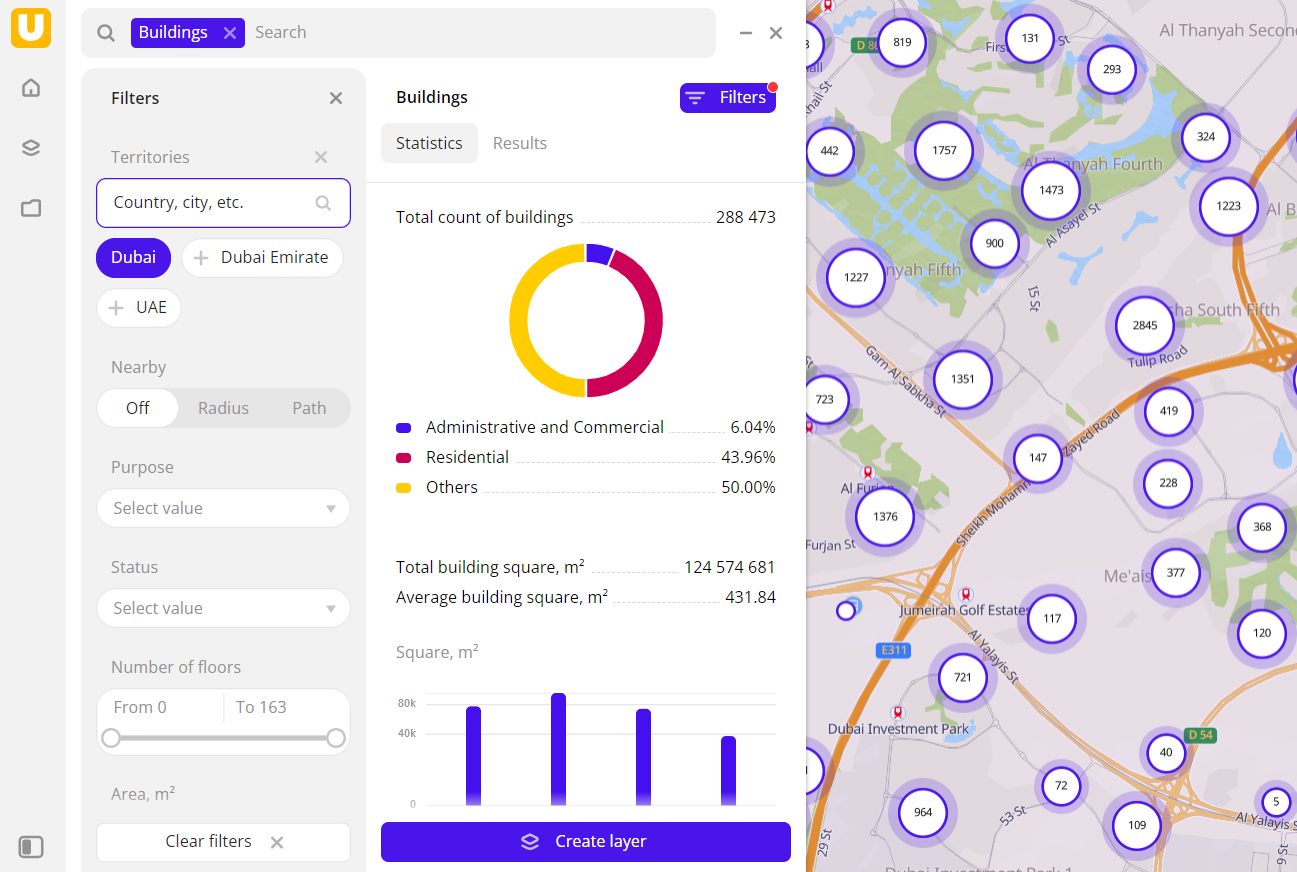
Statistics: general statistics about the sample:
- Total count of buildings.
- Chart with the distribution of buildings by purpose. Displayed if multiple building types are selected.
- Total and average area in m².
- Chart with the distribution of buildings by area.
- Maximum and average count of floors.
- Chart with the distribution of buildings by the count of floors.
- Maximum and average year of construction.
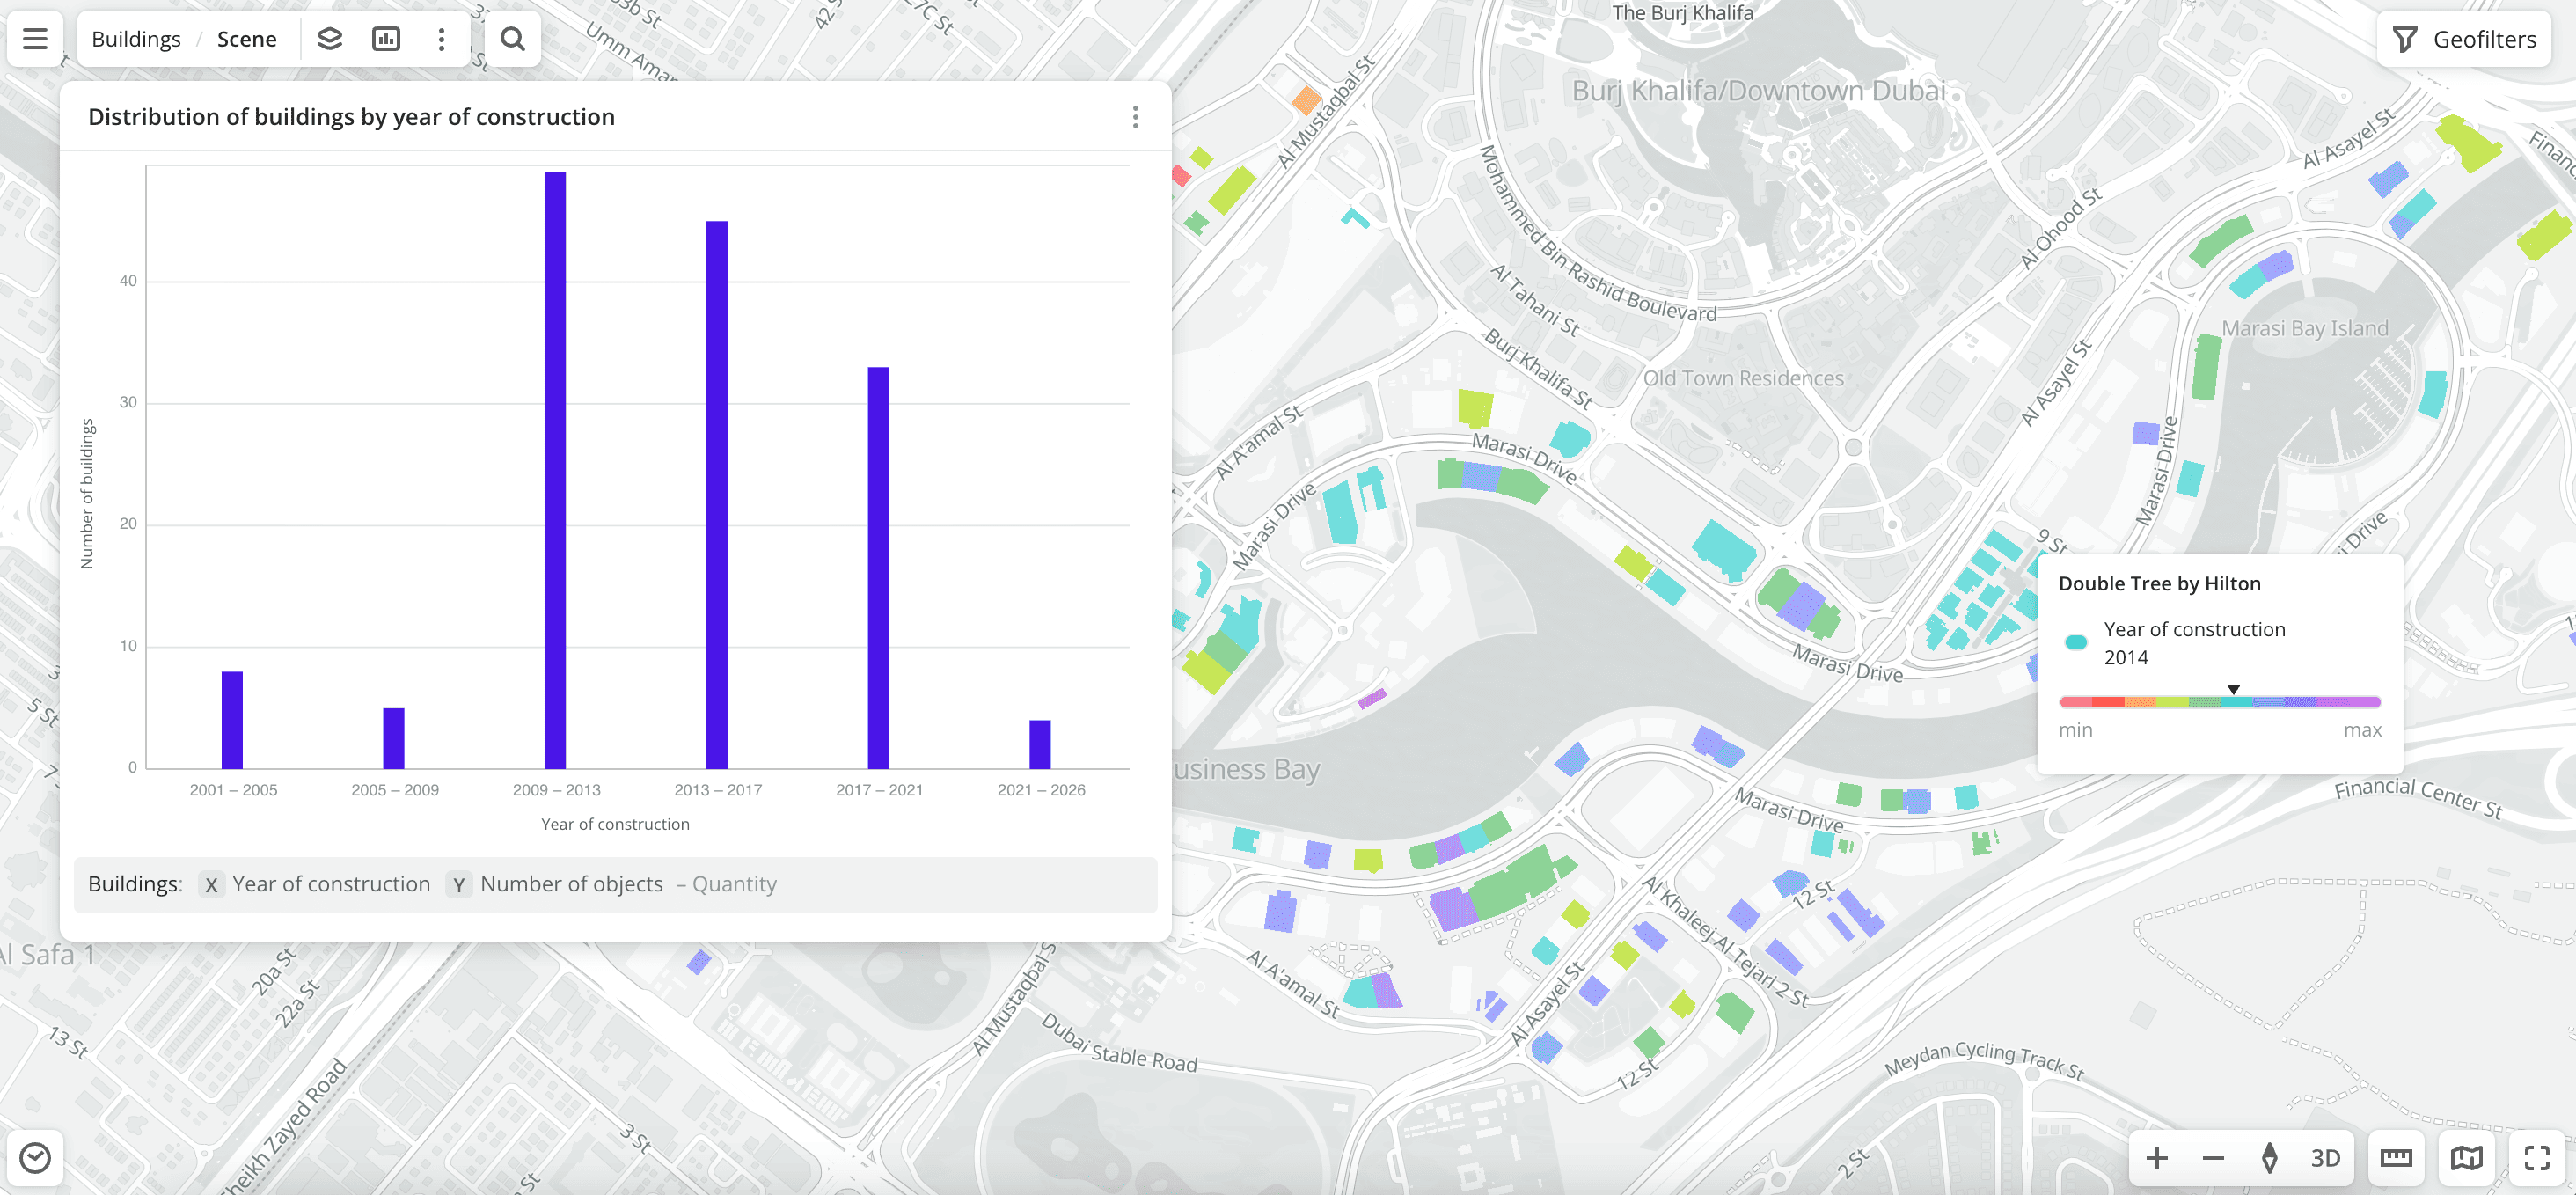
- Chart with the distribution of buildings by year of construction.
- Maximum and average count of organizations in a building.
- Chart with the distribution of buildings by the count of organizations in a building.
-
Results: general information about buildings and their list. When selecting a building from the list:
- Information about the building is displayed in the card.
- The location of the building is indicated on the map.
You can manually edit the list of filtering results to keep only selected buildings in the data sample. Click Edit list, select the required buildings, and click Apply.
To save the data sample, click Create layer and customize data visualization.
Filters
For the Buildings dataset, the following filters are available:
- Purpose: building type (e.g.,
Residential,Administrative and Commercial,Transport, etc.). For each type, subtypes are available (e.g., theTransportcategory containsAirport,Metro, and others subcategories). - Status: building construction status (e.g.,
Constructed,Under construction,Under repairing). - Number of floors: count of floors in the building. Can take
0value. - Area: area of the building foundation in square meters.
- Total area: total area of all building premises in square meters. Calculated as the building foundation area multiplied by the number of floors. If the building consists of parts with different numbers of floors, the foundation area of each part is multiplied by the number of floors in that part.
- Year of construction: year the building was constructed.
- Firms count: count of organizations registered in the building (see the Firms dataset).
- Living population: count of residents in the building (see the Population dataset).
- Working population: count of employees in the building (see the Population dataset).
- Floor type: type of floors installed in the building.
- Cultural heritage site: select to display only buildings that are cultural heritage objects.
To reset the parameter filter, click ![]() icon next to the filter name. To reset all parameter filters, click Reset filters at the bottom of the tab.
icon next to the filter name. To reset all parameter filters, click Reset filters at the bottom of the tab.
To hide the filter by territory, in the Geofilter settings dialog, click ![]() icon next to the geofilter name. To delete the geofilter, click
icon next to the geofilter name. To delete the geofilter, click ![]() icon next to its name. To delete all geofilters, click Clear filters.
icon next to its name. To delete all geofilters, click Clear filters.
Data visualization
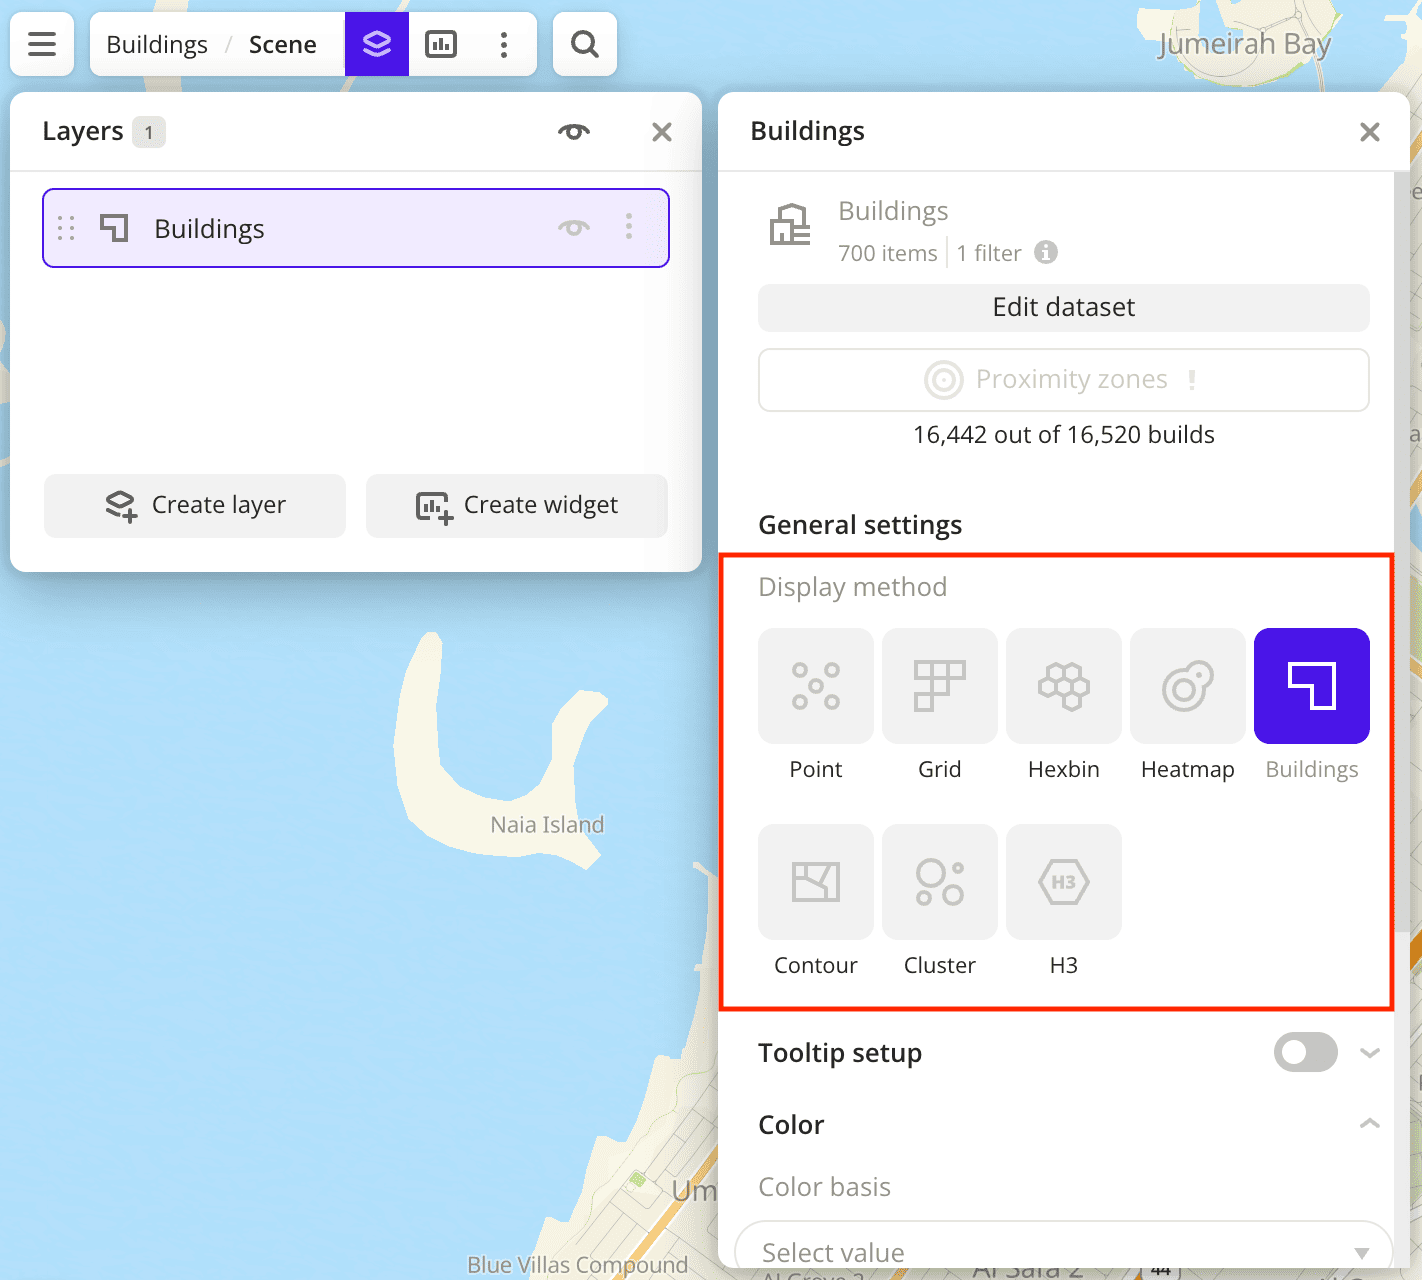
The following visualization methods are available for the dataset:
After creating the layer, configure a basic data visualization:
-
Select the Buildings visualization method:
-
To analyze the number of old and new buildings, change the color of points on the map depending on the year of construction. In the Color basis field, select the
Year of constructionattribute and specify the color scale: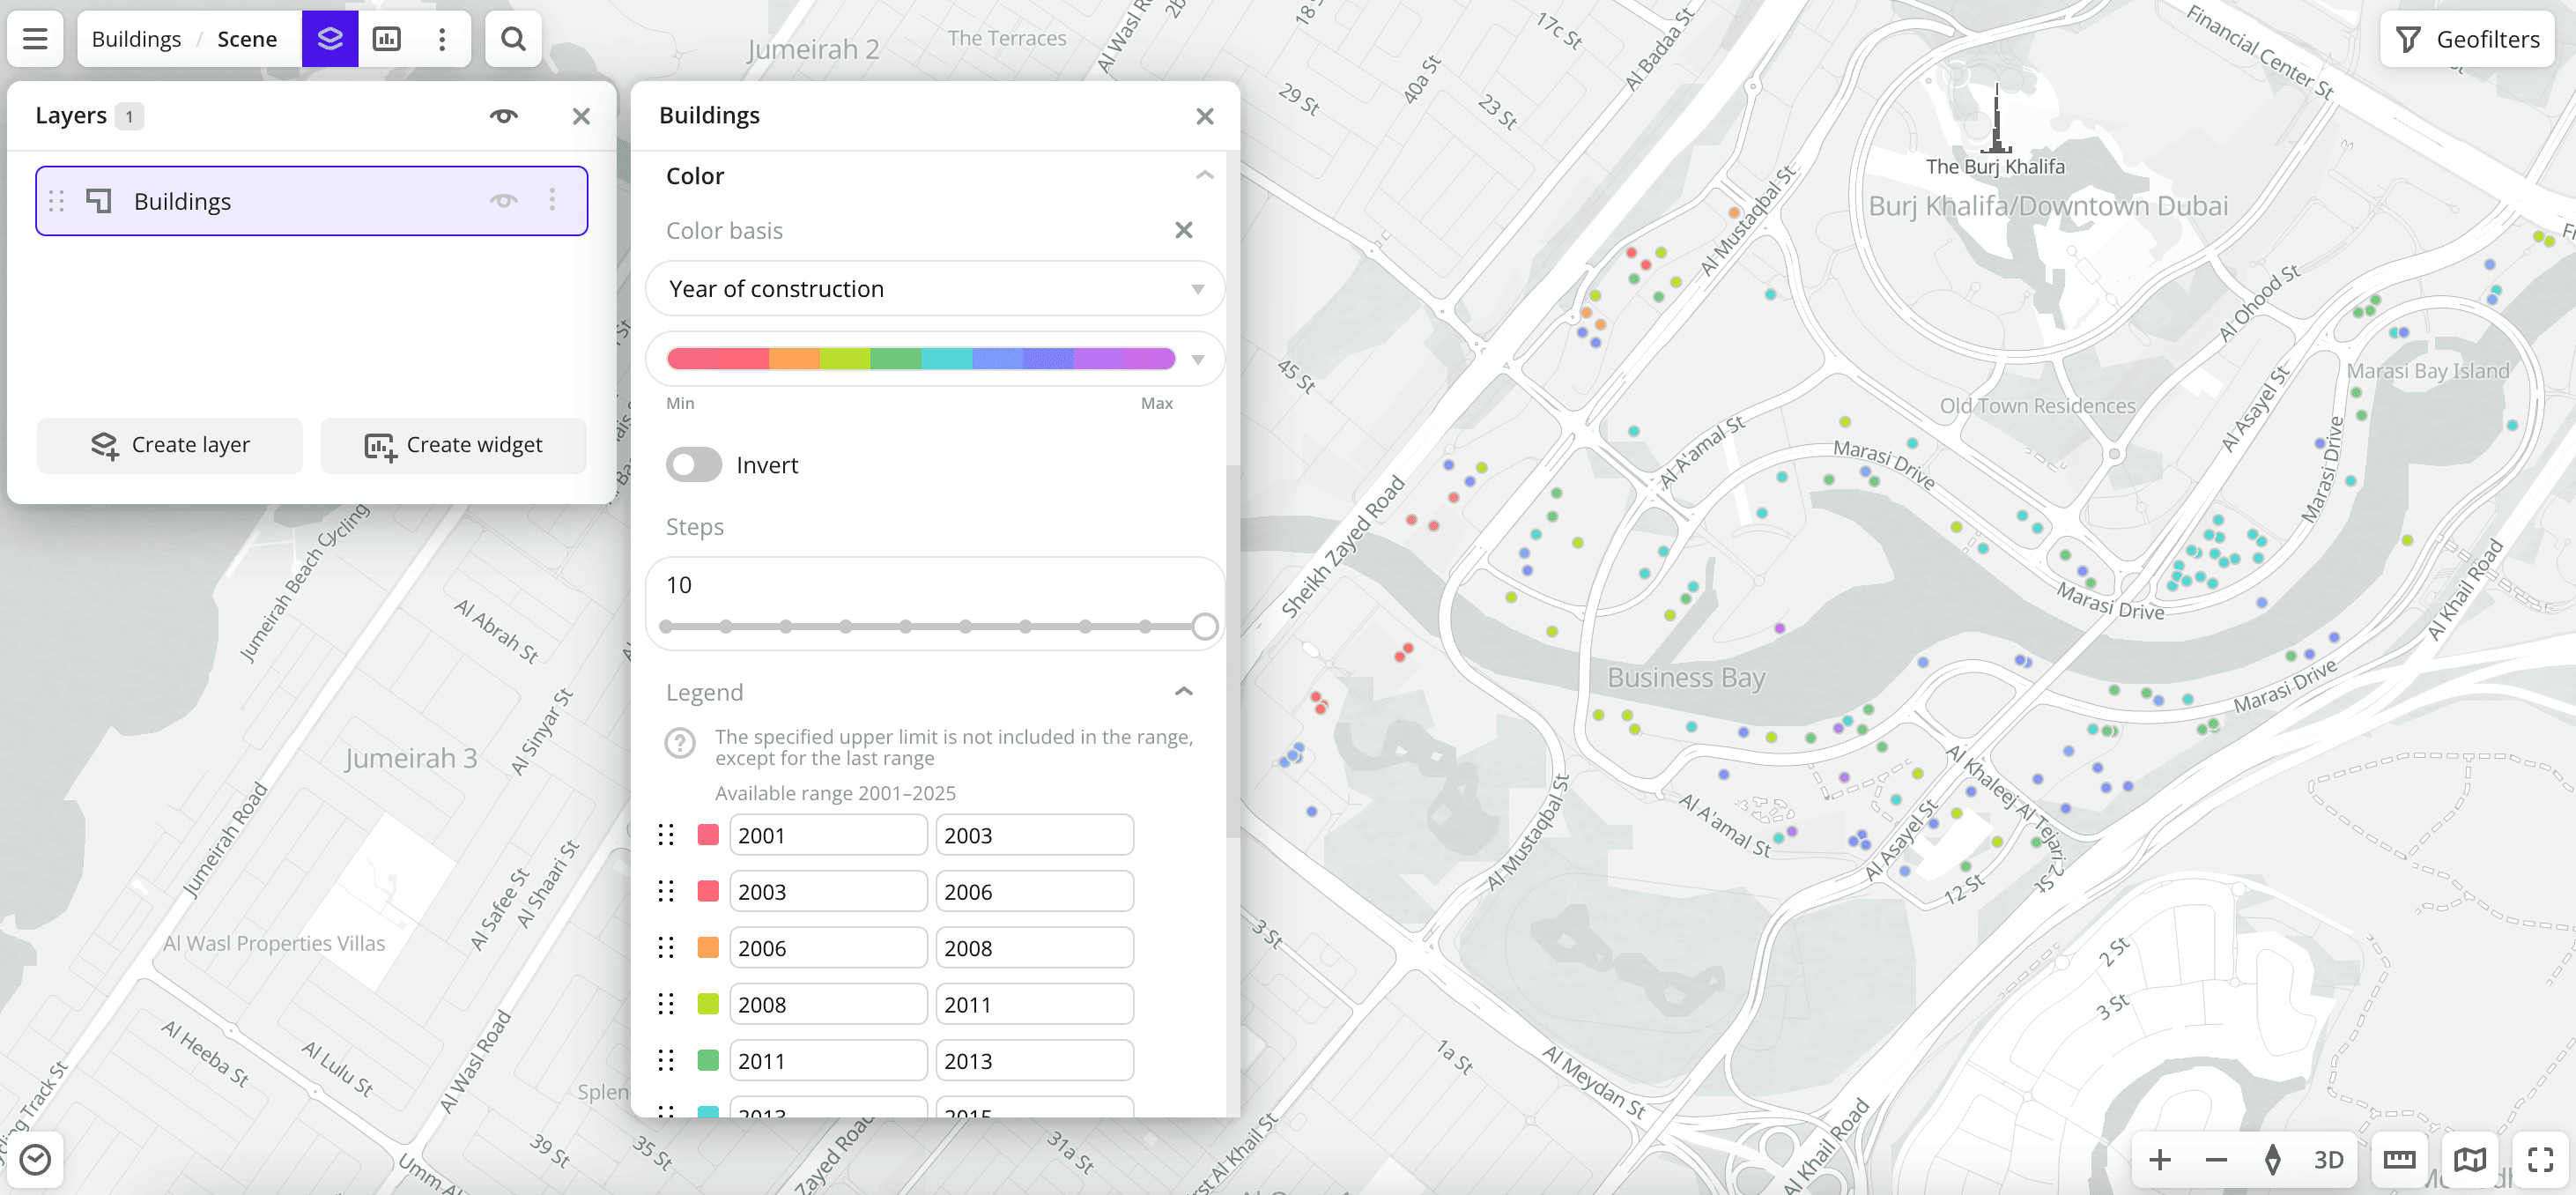
Data purchasing
You can purchase data separately as an export in the following formats:
- Table formats:
.csv.txt.json
- Formats for storing geographic data:
.shp(Shape).gpkg(GeoPackage).geojson(GeoJSON)
For more information about the price, available territories, and how to purchase data, fill out the form on urbi.ae.
What's next?
- Quick start.
- Get to know more about other Data categories.
- Get to know how to work with Data visualization.
- Get to know more about Layers, Dashboards, Scenes, and Widgets.
- Get to know prepared Analytics presets.