Dynamics of organizations
The Dynamics of organizations dataset provides information about organizations from the Urbi directory that opened or closed over the past year.
Usage scenarios
The Dynamics of organizations dataset helps to solve different problems:
- Improving business strategy. It helps to analyze the dynamics of closings of organizations to plan a development strategy, avoid investments in unprofitable areas, and predict risks for existing branches.
- Competitive environment analysis. It allows you to research the level of competition in different areas and categories, compare competitor activity with the number of operating companies (see the Firms dataset), and identify untapped niches.
- Monitoring business environment activity. It allows you to make informed decisions and avoid mistakes when opening new branches. For example, not to open a business in "red zones" where the number of organization closings exceeds the number of openings, and to identify developing areas where organizations are actively opening. It also helps to assess the viability of a business in certain areas based on data on the average lifetime of organizations.
How is the data collected?
The data about organizations is obtained from the Urbi directory. It is regularly collected and verified by Urbi specialists.
Data update and history
- Update frequency: data is updated once a week.
- History: historical data for the last 12 months is available.
Available territories
Data is available for the following countries:
- Oman
- Qatar
- Saudi Arabia
- UAE
The data may not be available throughout the entire country, but only in populated areas where Urbi is present. To check data availability, use geofilters or contact the technical support.
Data availability
- On-Cloud (Urbi Pro service): data is available upon request and is not available in the demo tariff. To start working with full data, change the tariff and request access to the dataset.
- On-Premise (installation of the service in a private environment): data is available.
Getting started

-
Go to the Main or Data tab.
-
Select the Dynamics of organizations dataset.
-
In the Geofilter settings dialog, select up to 50 territories for which the data sample is created. You can use standard and custom territories, and also build proximity zones and circles on the map. For more information, see the Geofilters section. After you select the territories, click Done.
-
On the Filters tab, select basic filters for data analysis:
- To view data about organizations in a particular category, click Select categories, select one or more categories, and click Apply. For example, select Food service → Pastry shops.
- To analyze data on openings of organizations, select the
Opening a companyvalue in the Event type filter.
-
Set the remaining filters if necessary.
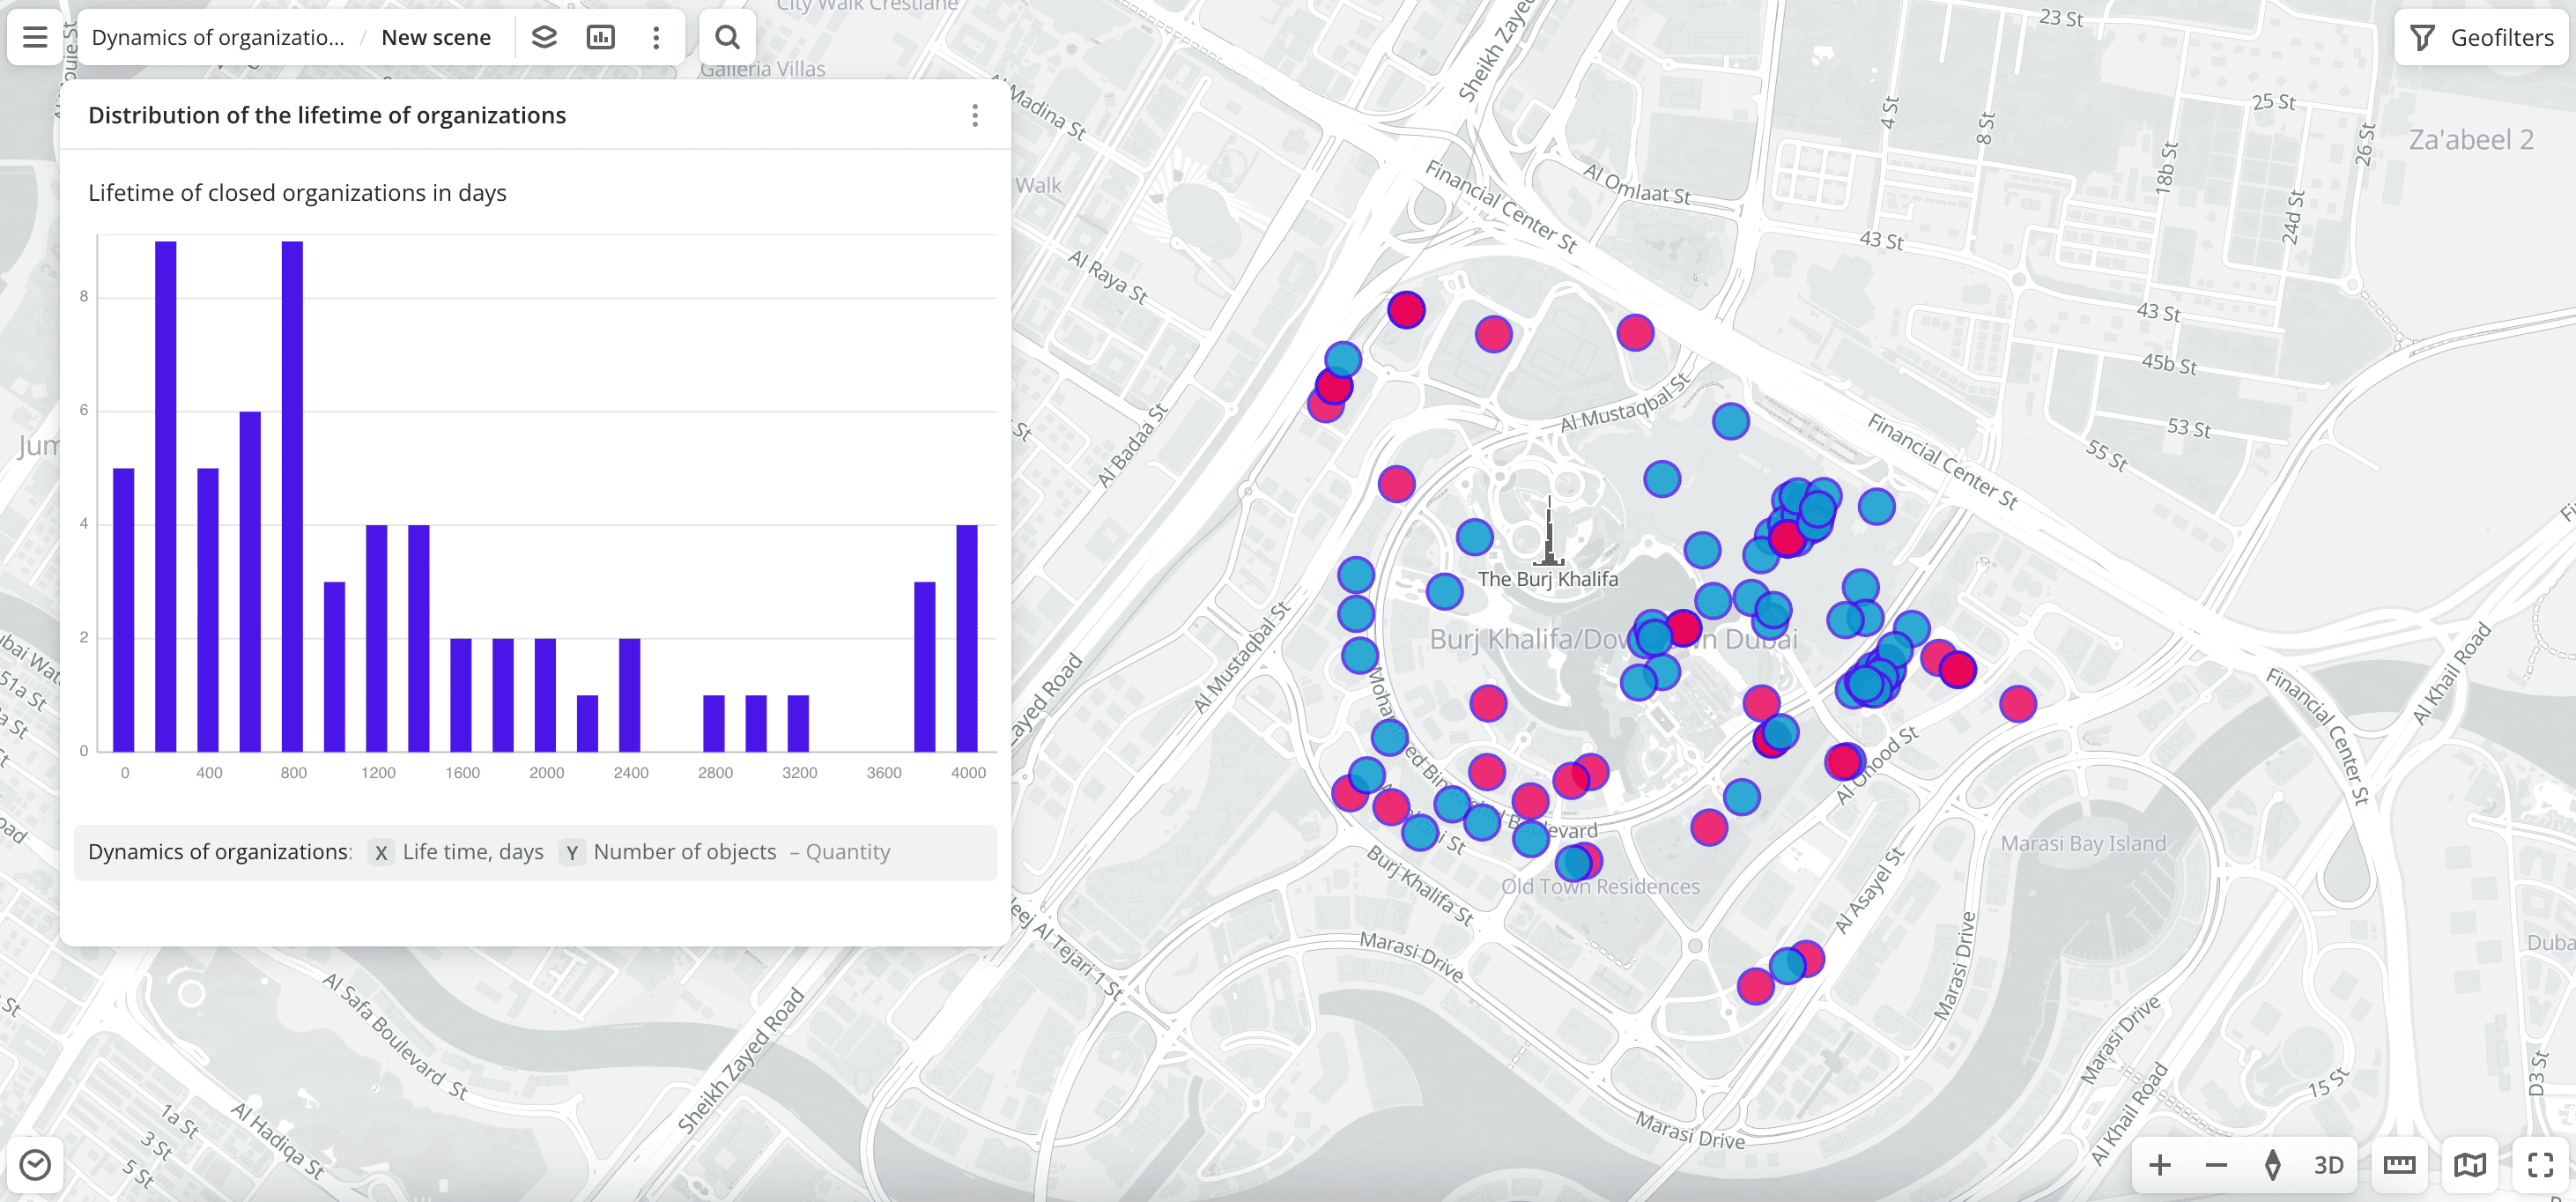
The data is displayed on the map as points. Filtering results are available on two tabs:
-
Statistics: general statistics about the sample:
- Count of opened organizations.
- Count of closed organizations.
- Average lifetime of organizations, in days.
- Median lifetime of organizations, in days.
- Chart with the percentage distribution of opened organizations by subcategory. Displayed if multiple subcategories are selected.
- Chart with the percentage distribution of closed organizations by subcategory. Displayed if multiple subcategories are selected.
-
Results: general information about organizations and their list. When selecting an organization from the list:
- Information about the organization is displayed in the card.
- The location of the organization is indicated on the map.
You can manually edit the list of filtering results to keep only selected organizations in the data sample. Click Edit list, select the required organizations, and click Apply.
To save the data sample, click Create layer and customize data visualization.
Filters
For the Dynamics of organizations dataset, the following filters are available:
-
Categories: categories of organizations in the directory. More than 1500 subcategories are also available (e.g., category
Food servicecontains thePastry shopssubcategory).You can select multiple categories and subcategories. Click Select categories, select categories from the list, and click Apply.
If an organization has multiple subcategories (e.g., Food court and Coffee shop), it displays in the filtering results even if the filter only by one subcategory is applied (e.g., Coffee shop).
-
Firm: search for a particular organization in the directory by name.
-
Event type:
Opening a companyandClosing a company. -
Event date: period of openings and closings of organizations.
-
Year and month: year and month to display data. You can select multiple values.
-
Lifetime, days: number of days the organization was open. Available only for closed organizations.
To reset the parameter filter, click ![]() icon next to the filter name. To reset all parameter filters, click Reset filters at the bottom of the tab.
icon next to the filter name. To reset all parameter filters, click Reset filters at the bottom of the tab.
To hide the filter by territory, in the Geofilter settings dialog, click ![]() icon next to the geofilter name. To delete the geofilter, click
icon next to the geofilter name. To delete the geofilter, click ![]() icon next to its name. To delete all geofilters, click Clear filters.
icon next to its name. To delete all geofilters, click Clear filters.
Data visualization
The following visualization methods are available for the dataset:
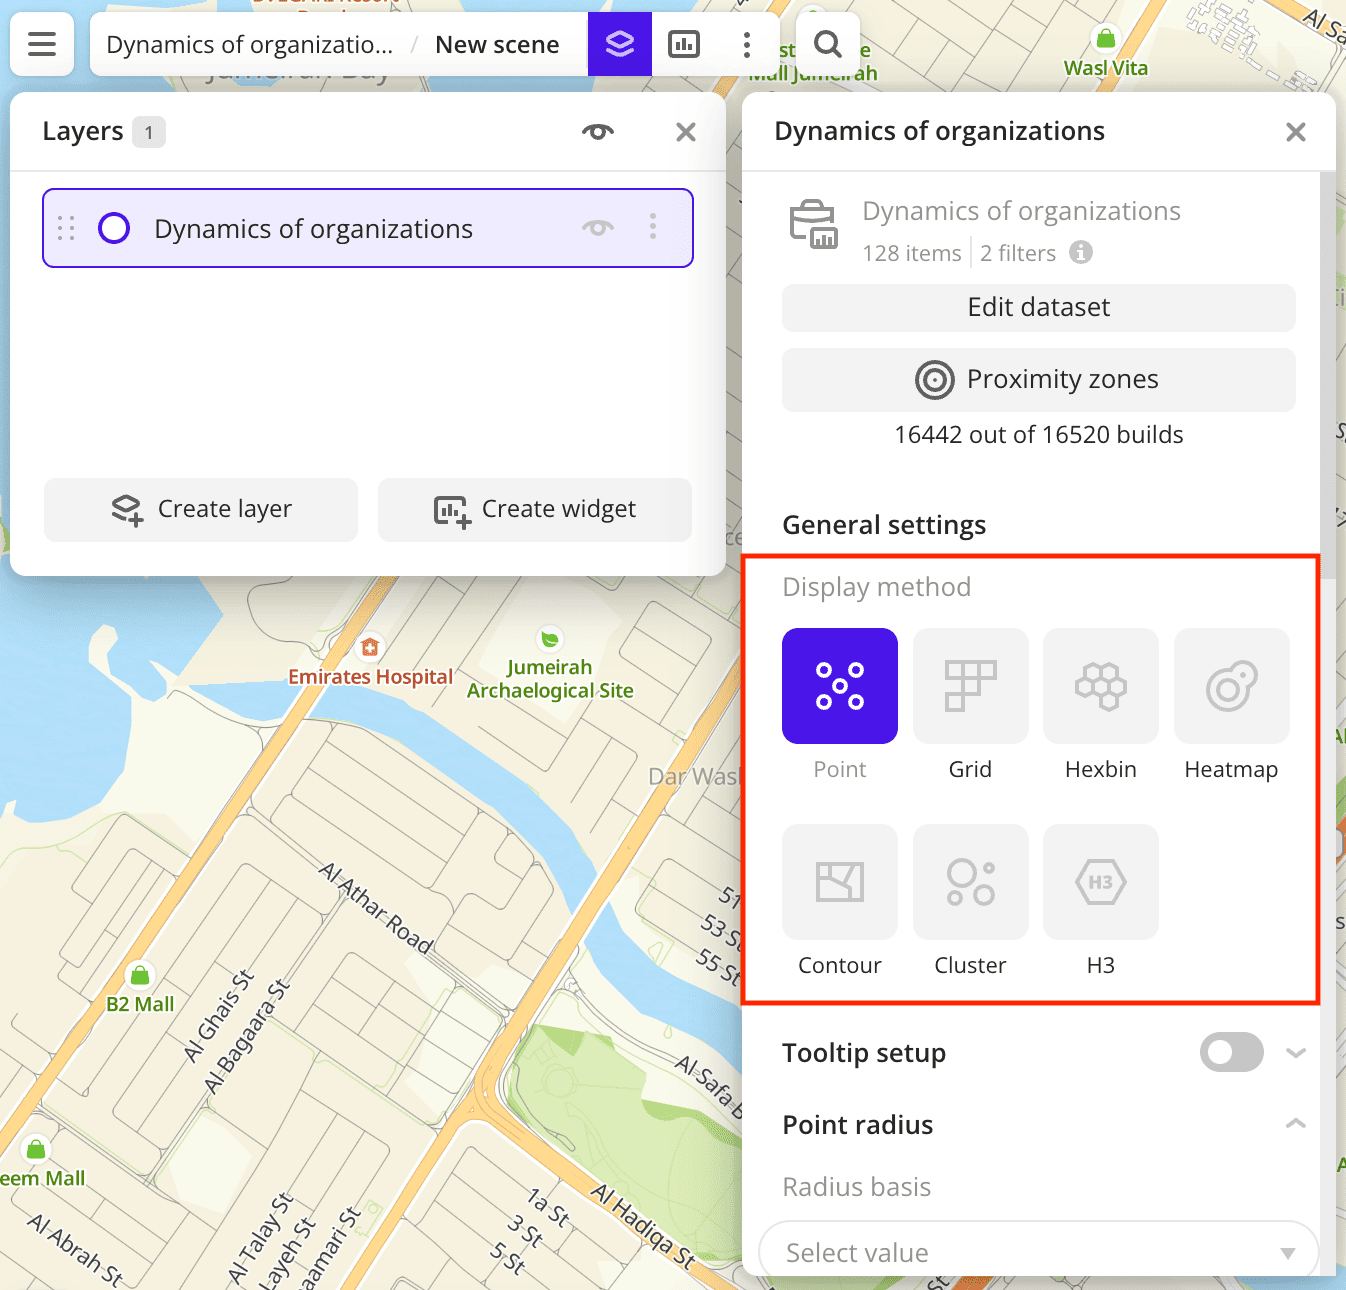
After creating the layer, configure a basic data visualization:
-
Select the Point visualization method:
-
To configure a tooltip, enable the Tooltip setup option and select the basic data attributes
Event typeandLifetime, days(displaying only for closed organizations):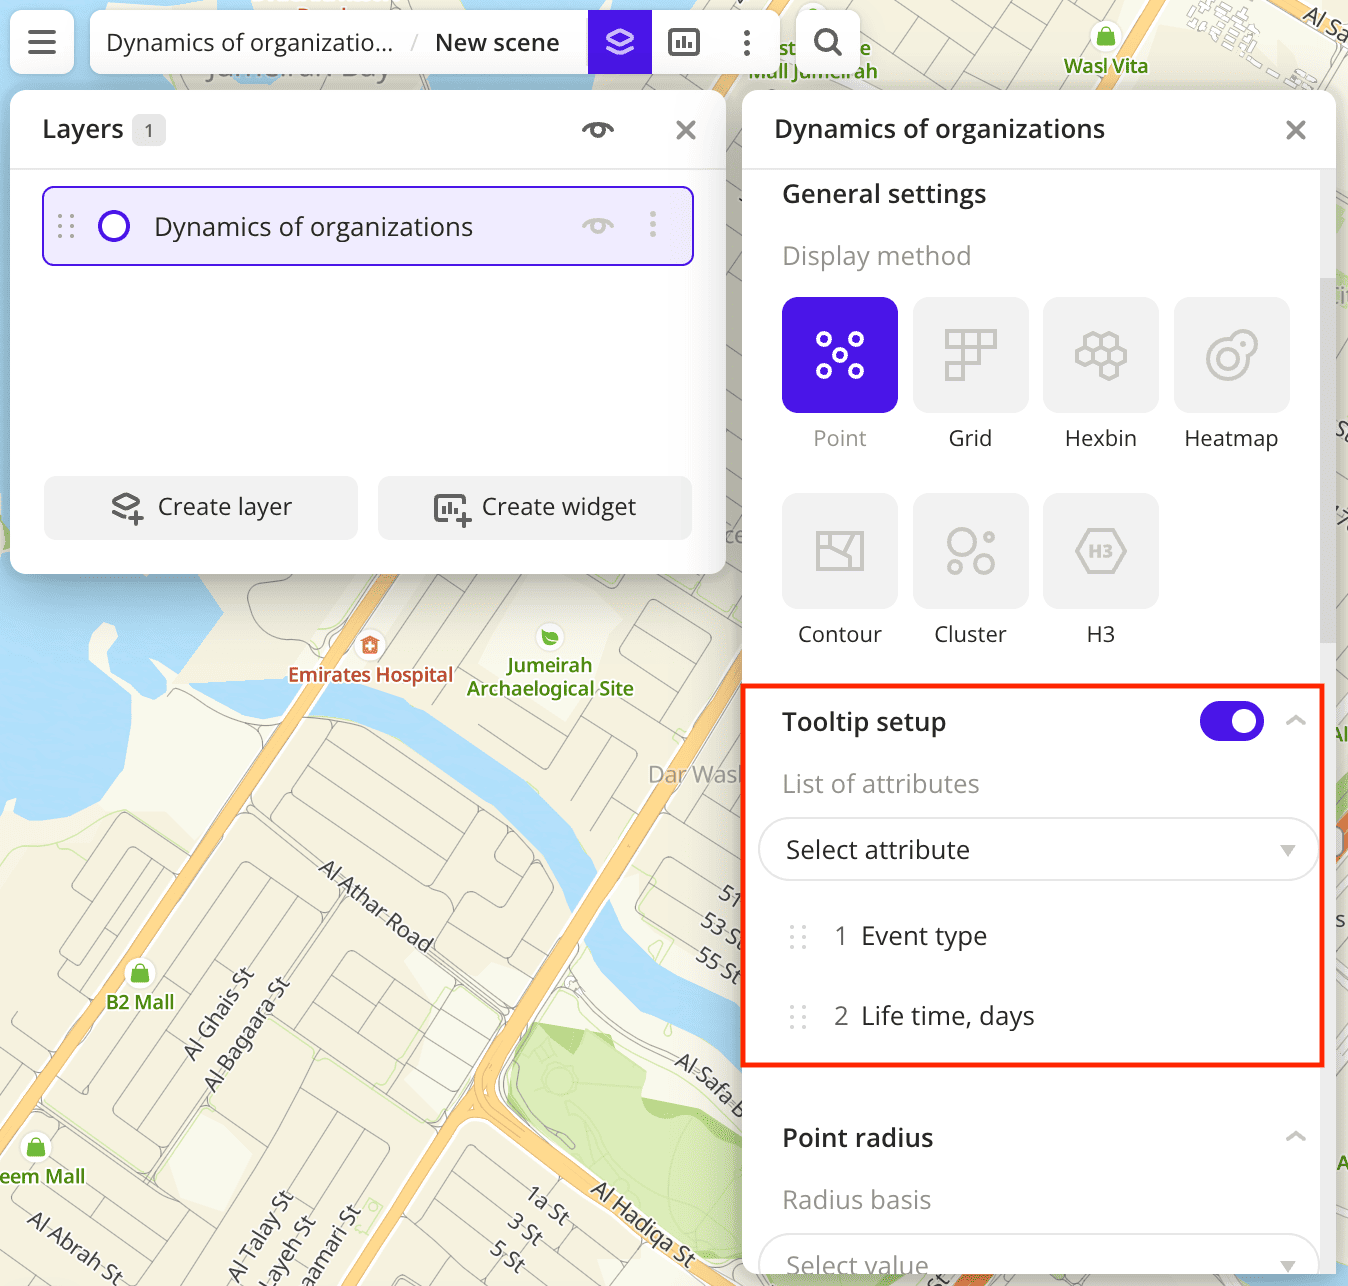
-
To analyze the dynamics of organization opening and closing, change the color of the points on the map depending on the event type. In the Color basis field, select the
Event typeattribute and specify the color scale: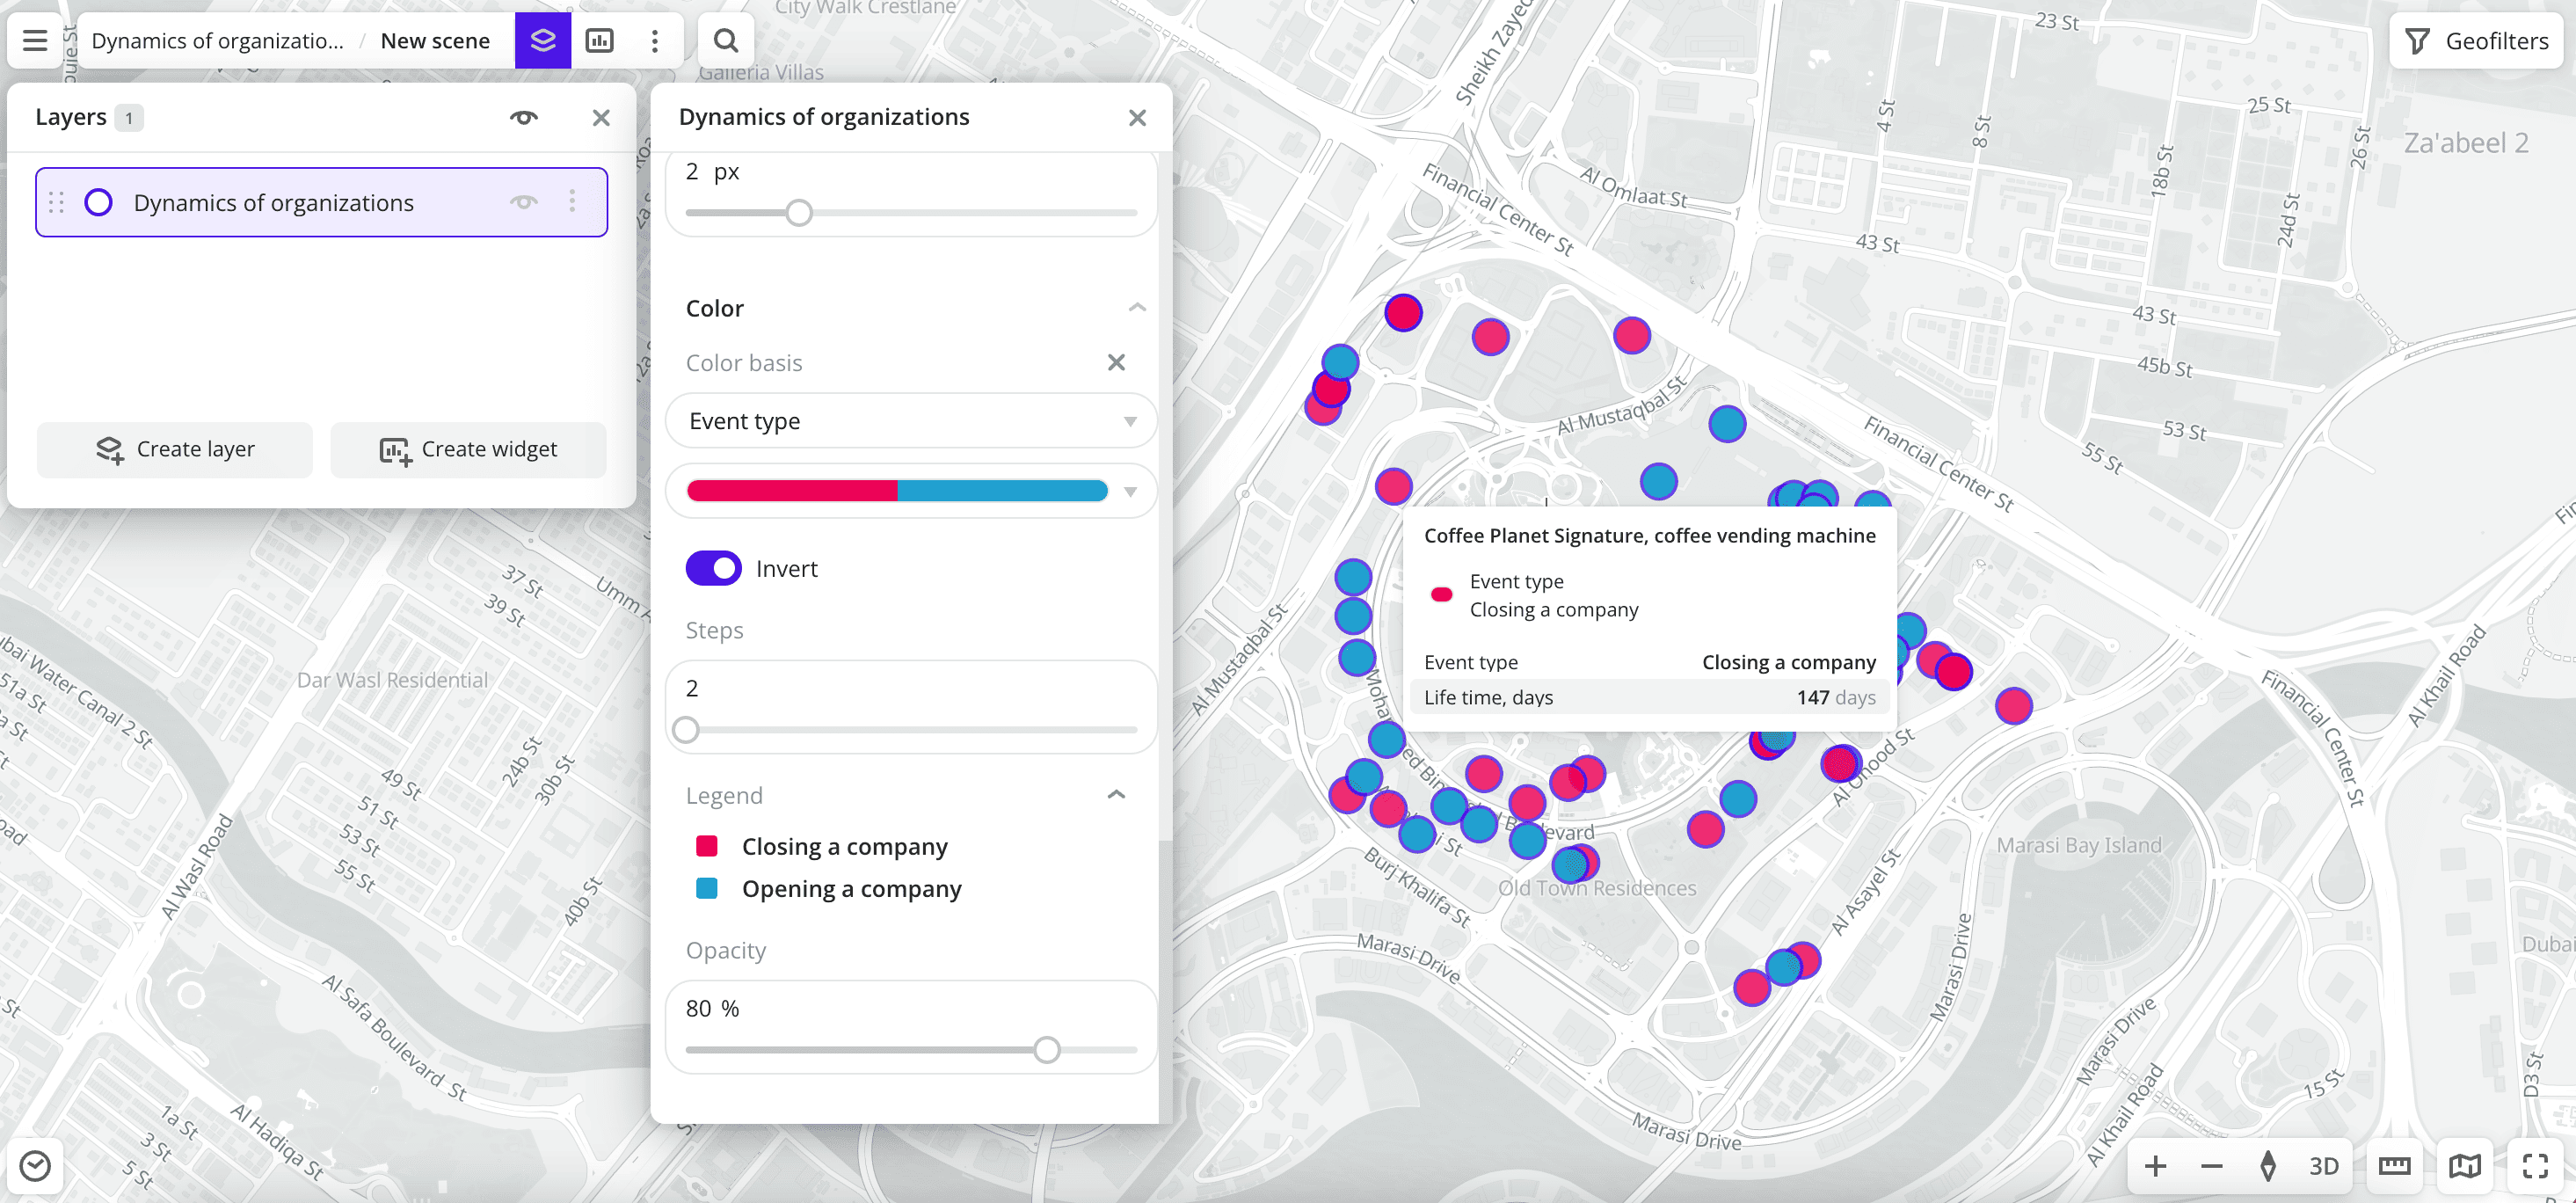
Data purchasing
You can purchase data separately as an export in the following formats:
- Table formats:
.csv.txt.json
- Formats for storing geographic data:
.shp(Shape).gpkg(GeoPackage).geojson(GeoJSON)
For more information about the price, available territories, and how to purchase data, fill out the form on urbi.ae.
What's next?
- Quick start.
- Get to know more about other Data categories.
- Get to know how to work with Data visualization.
- Get to know more about Layers, Dashboards, Scenes, and Widgets.
- Get to know prepared Analytics presets.