Territorial division
The Territorial Division dataset provides information on the geographic boundaries of territories (units of territorial division) at different levels: regions, districts, settlements, etc. For each territory, basic statistical indicators are presented: area, population, and others.
Usage scenarios
The Territorial division dataset helps to solve different problems:
- Retail and food service network development. It helps retailers, hospitality businesses, and service companies to make decisions about opening locations in new areas using statistical indicators across different territories.
- Search for promising residential areas. It helps to identify residential areas with high population density and low density of organizations and to make decisions about opening a store or cafe, using data on the number of organizations and population.
How is the data collected?
The data is collected and regularly verified by Urbi specialists.
Data update and history
- Update frequency: data is updated once a week.
- History: historical data is not available. You can only view the latest updated data.
Available territories
Data is available for the following countries:
- Oman
- Qatar
- Saudi Arabia
- UAE
The data may not be available throughout the entire country, but only in populated areas where Urbi is present. To check data availability, use geofilters or contact the technical support.
Data availability
- On-Cloud (Urbi Pro service): data is available upon request and is not available in the demo tariff. To start working with the data, change the tariff and request access to the dataset.
- On-Premise (installation of the service in a private environment): data is available.
Getting started
- Go to the Main or Data tab.
- Select the Territorial division dataset.
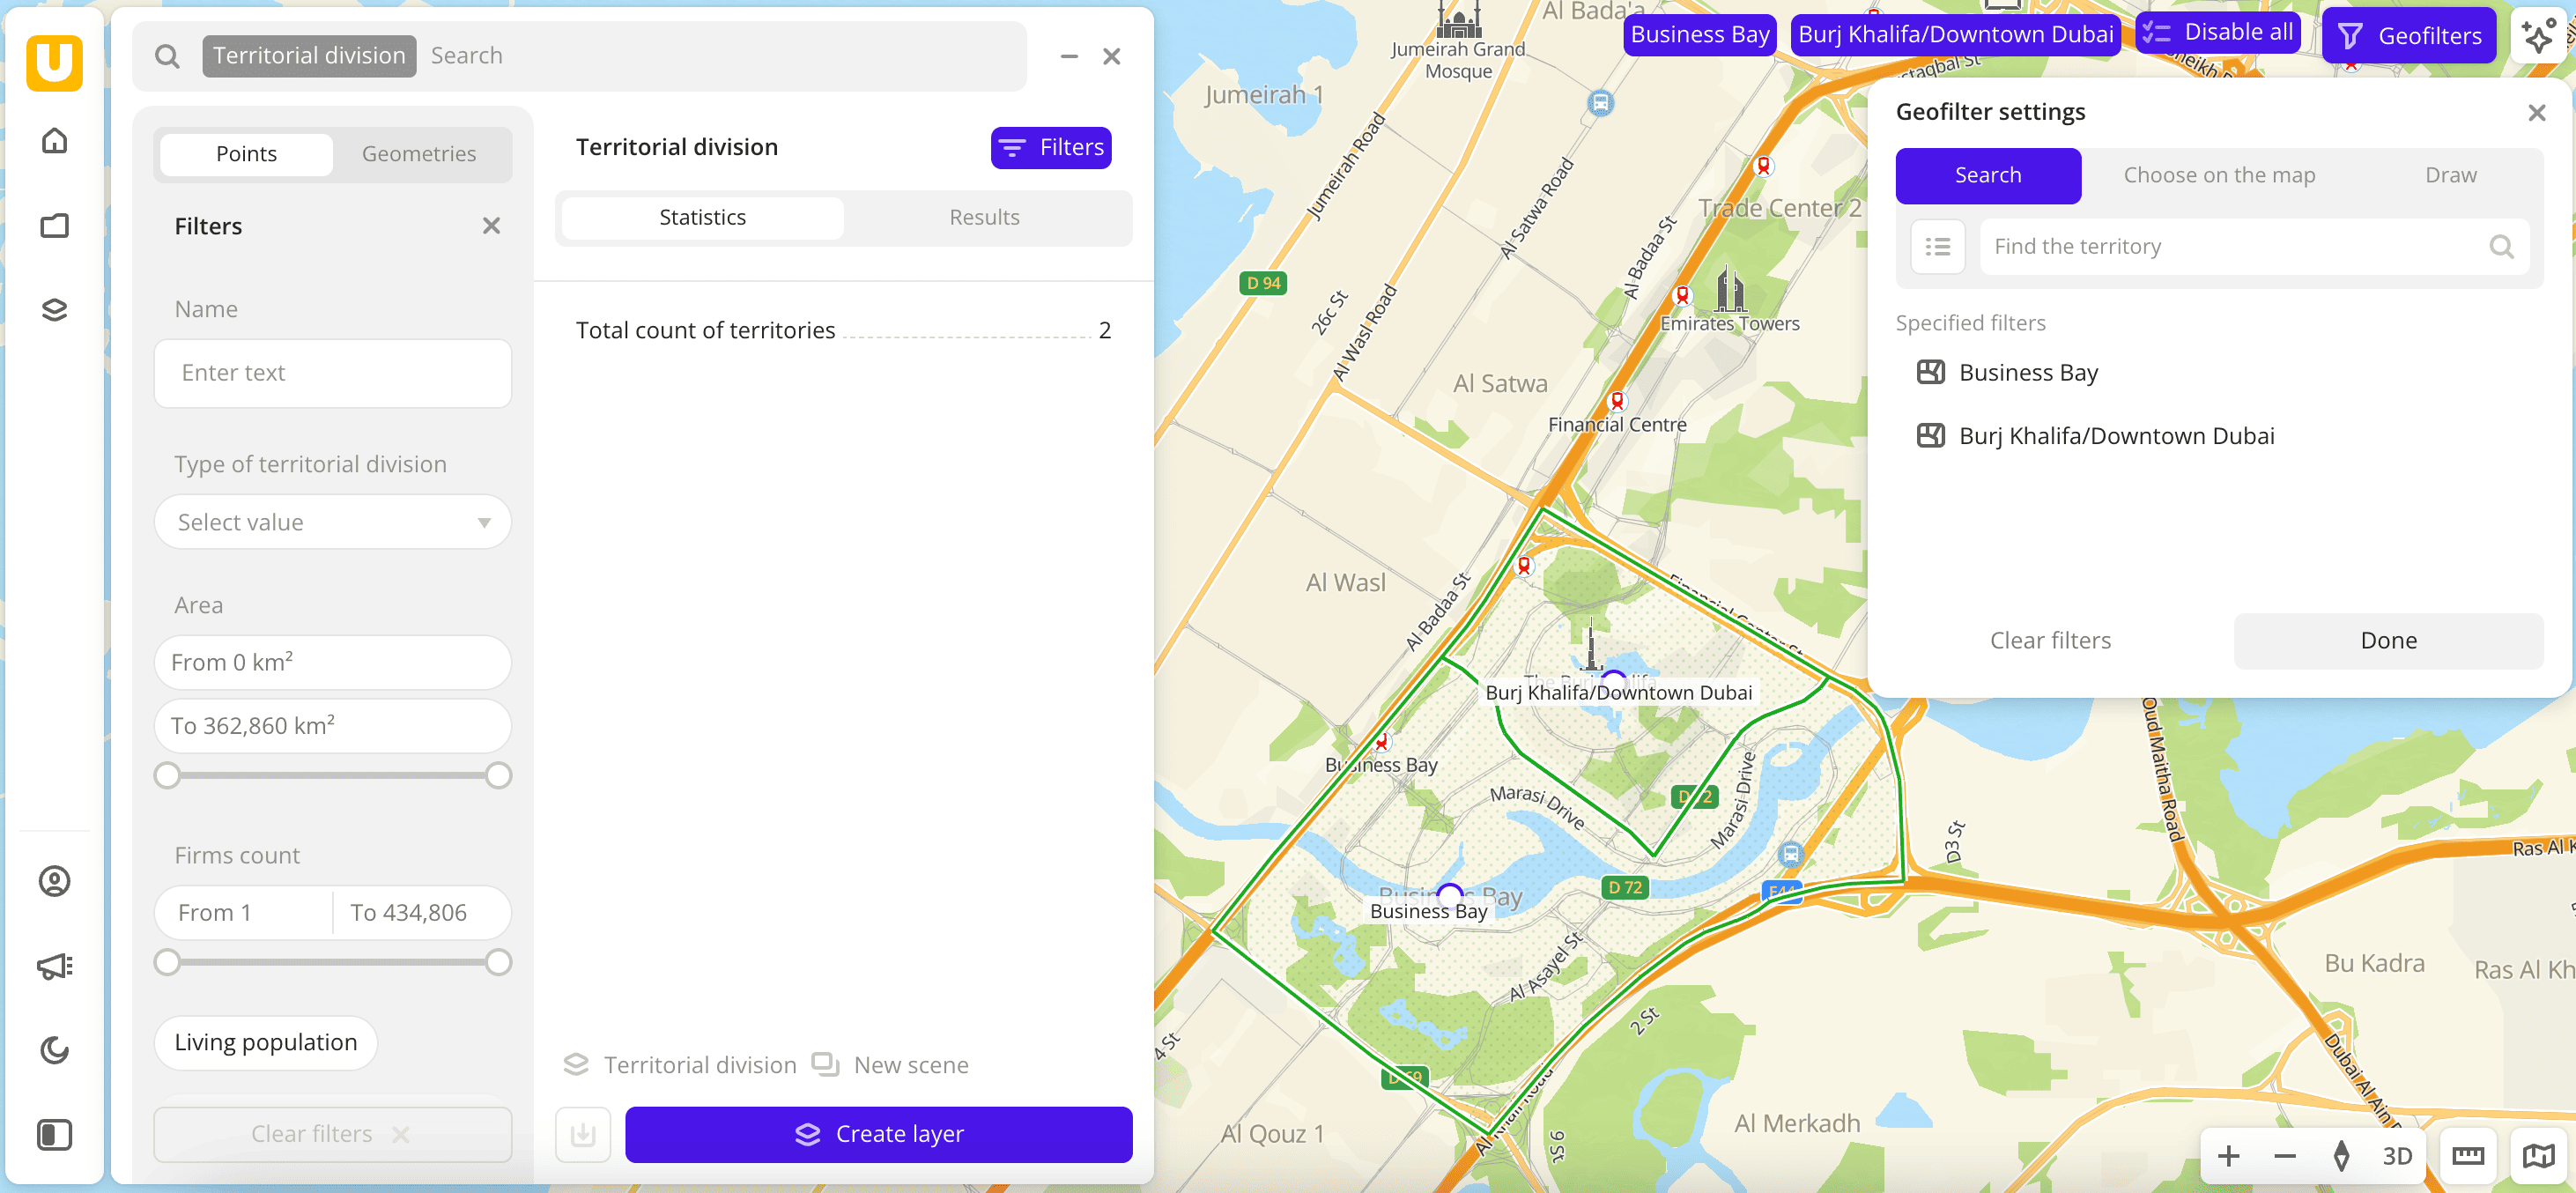
- In the Geofilter settings dialog, select up to 50 territories for which the data sample is created. You can use standard and custom territories, and also build proximity zones and circles on the map. For more information, see the Geofilters section. After you select the territories, click Done.
- On the Filters tab, select the basic filter for data analysis: Type of territorial division. It is recommended to select only one type of territorial division for one layer, otherwise the polygons on the map overlap each other.
- Set the remaining filters if necessary.
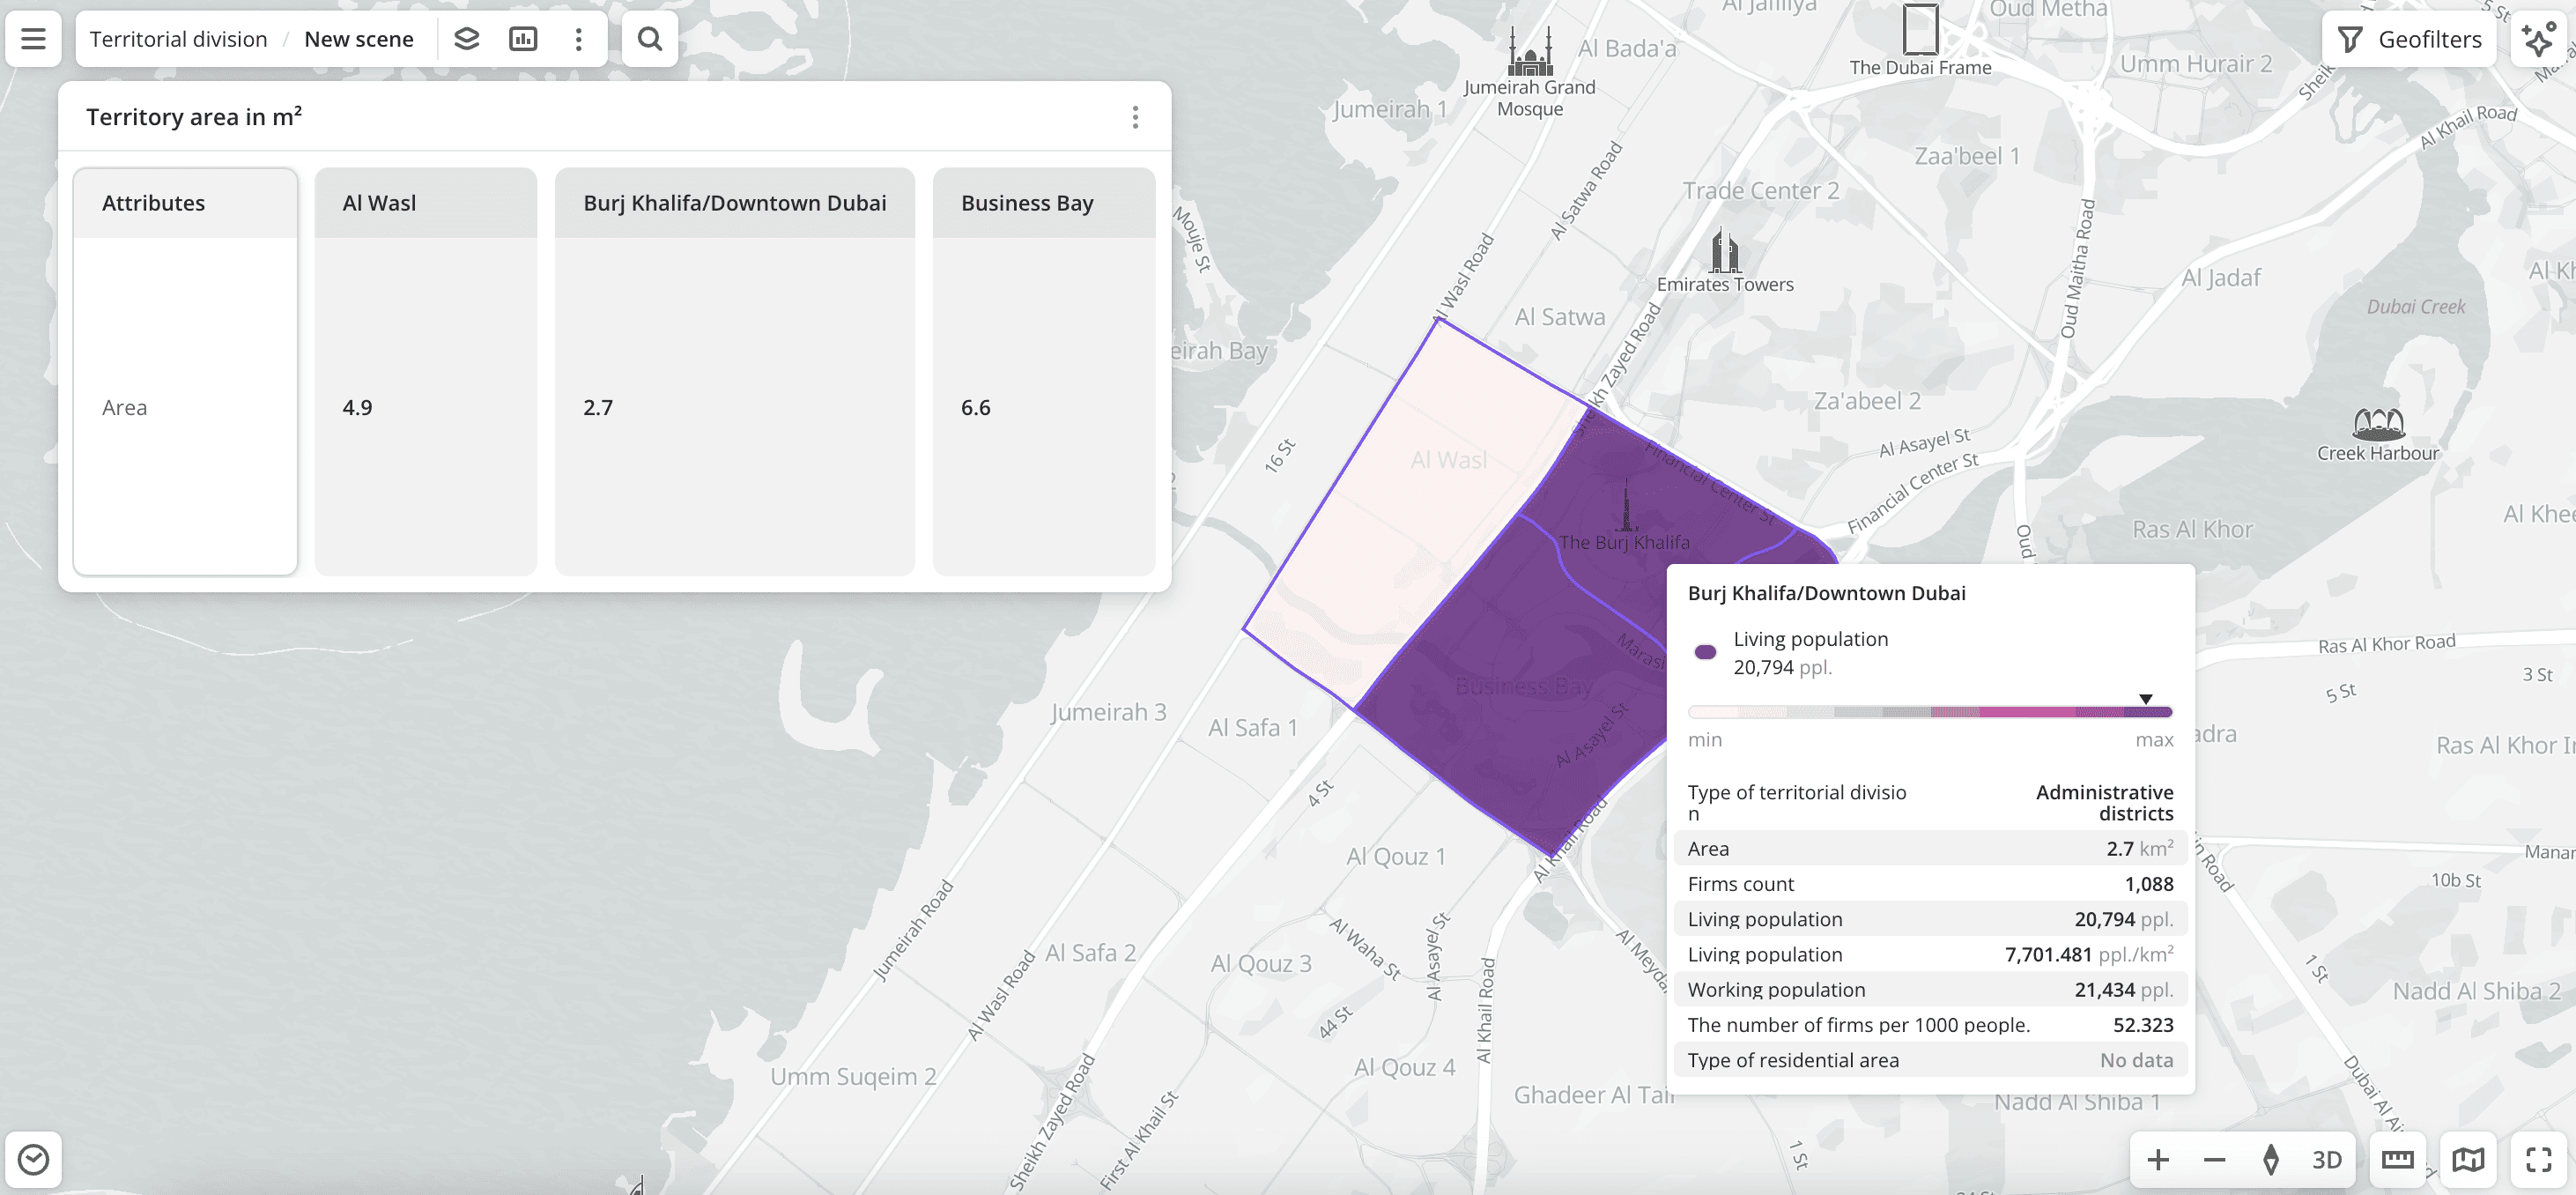
The data is displayed on the map as polygons. Filtering results are available on two tabs:
-
Statistics: total count of territories.
-
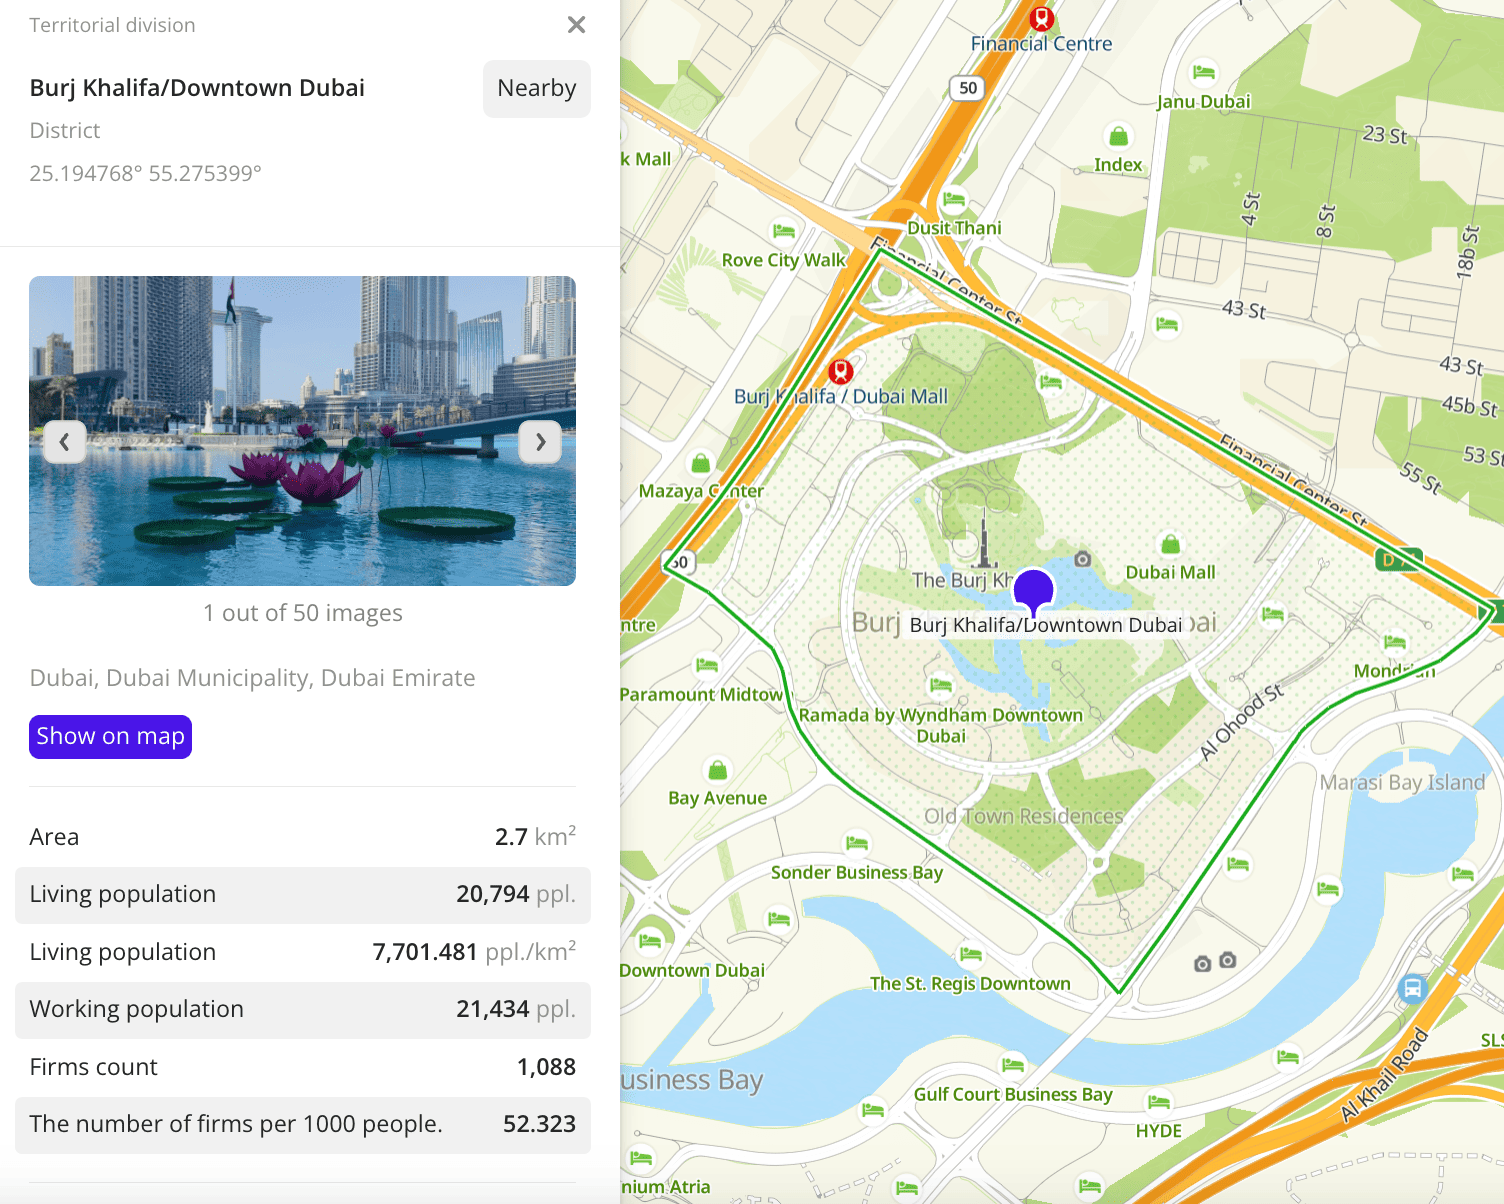
Results: general information about territories and their list. When selecting a territory from the list:
-
The location of the territory is indicated on the map.
-
Information about the territory is displayed in the card:
- Territory area in km².
- Total count of the living population.
- Density of the living population in people per km².
- Total count of the working population.
- Total count of organizations from all categories.
- Count of organizations per 1000 residents.
You can manually change the list of filtering results to keep only selected territories in the data sample. Click Edit list, select the required territories, and click Apply.
-
To save the data sample, click Create layer and customize data visualization.
Filters
For the Territorial division dataset, the following filters are available:
-
Name: search for a territory by name (e.g.,
DubaiorBusiness Bay). -
Type of territorial division: type of territory. Available types:
- Countries.
- Regions.
- Amanas.
- Districts: municipal districts. Example: Dubai Municipality.
- Settlements.
- Administrative divisions.
- Rural settlements.
- Administrative districts: city areas. Example: Business Bay in Dubai.
- Neighborhoods: residential areas.
- Places: housing complexes and others.
-
Area: territory area in km².
-
Firms count: count of organizations located in the territory (see the Firms dataset).
-
Living population: count of residents in the territory (see the Population dataset).
-
Living population density: ratio of the living population to the territory area.
-
Working population: count of employees of organizations located in the territory (see the Population dataset).
-
Number of firms per 1000 people: count of organizations located in the territory per 1000 residents.
To reset the parameter filter, click ![]() icon next to the filter name. To reset all parameter filters, click Reset filters at the bottom of the tab.
icon next to the filter name. To reset all parameter filters, click Reset filters at the bottom of the tab.
To hide the filter by territory, in the Geofilter settings dialog, click ![]() icon next to the geofilter name. To delete the geofilter, click
icon next to the geofilter name. To delete the geofilter, click ![]() icon next to its name. To delete all geofilters, click Clear filters.
icon next to its name. To delete all geofilters, click Clear filters.
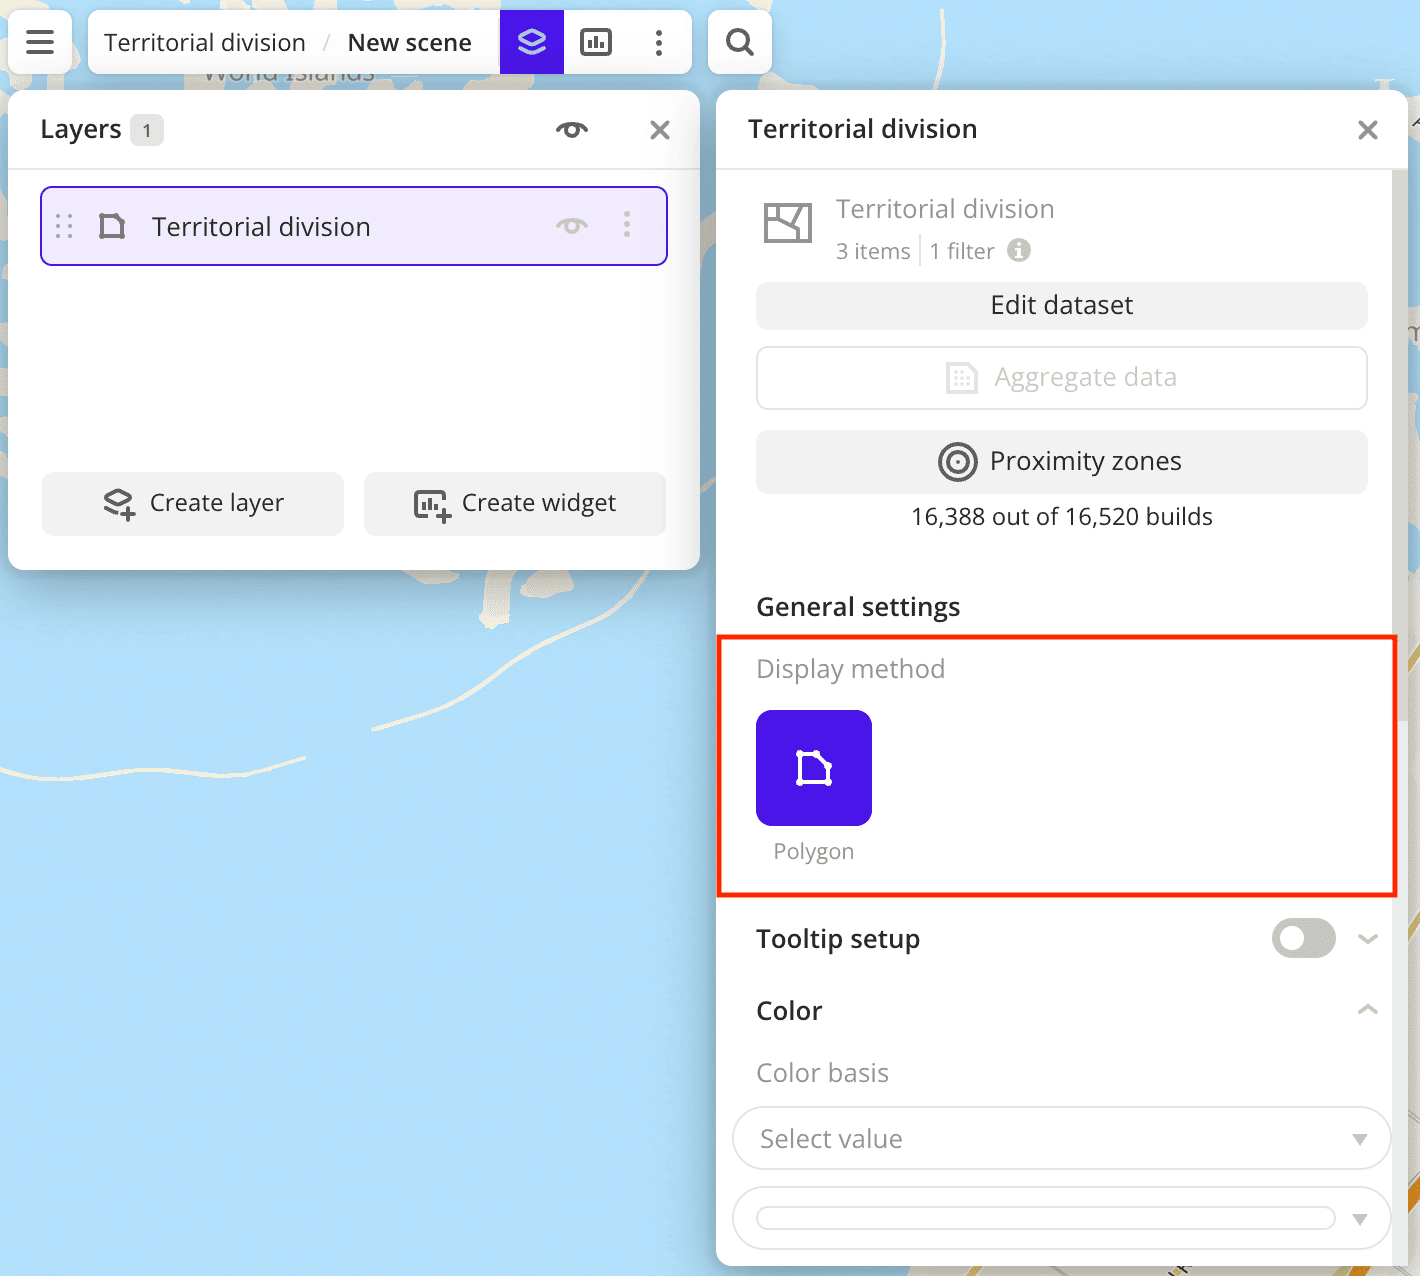
Data visualization
For the dataset, only the Polygon visualization method is available.
After creating the layer, configure a basic data visualization:
-
Select the Polygon visualization method:
-
To analyze the population in different areas, change the color of polygons on the map depending on the count of residents. In the Color basis field, select the
Living populationattribute and specify the color scale: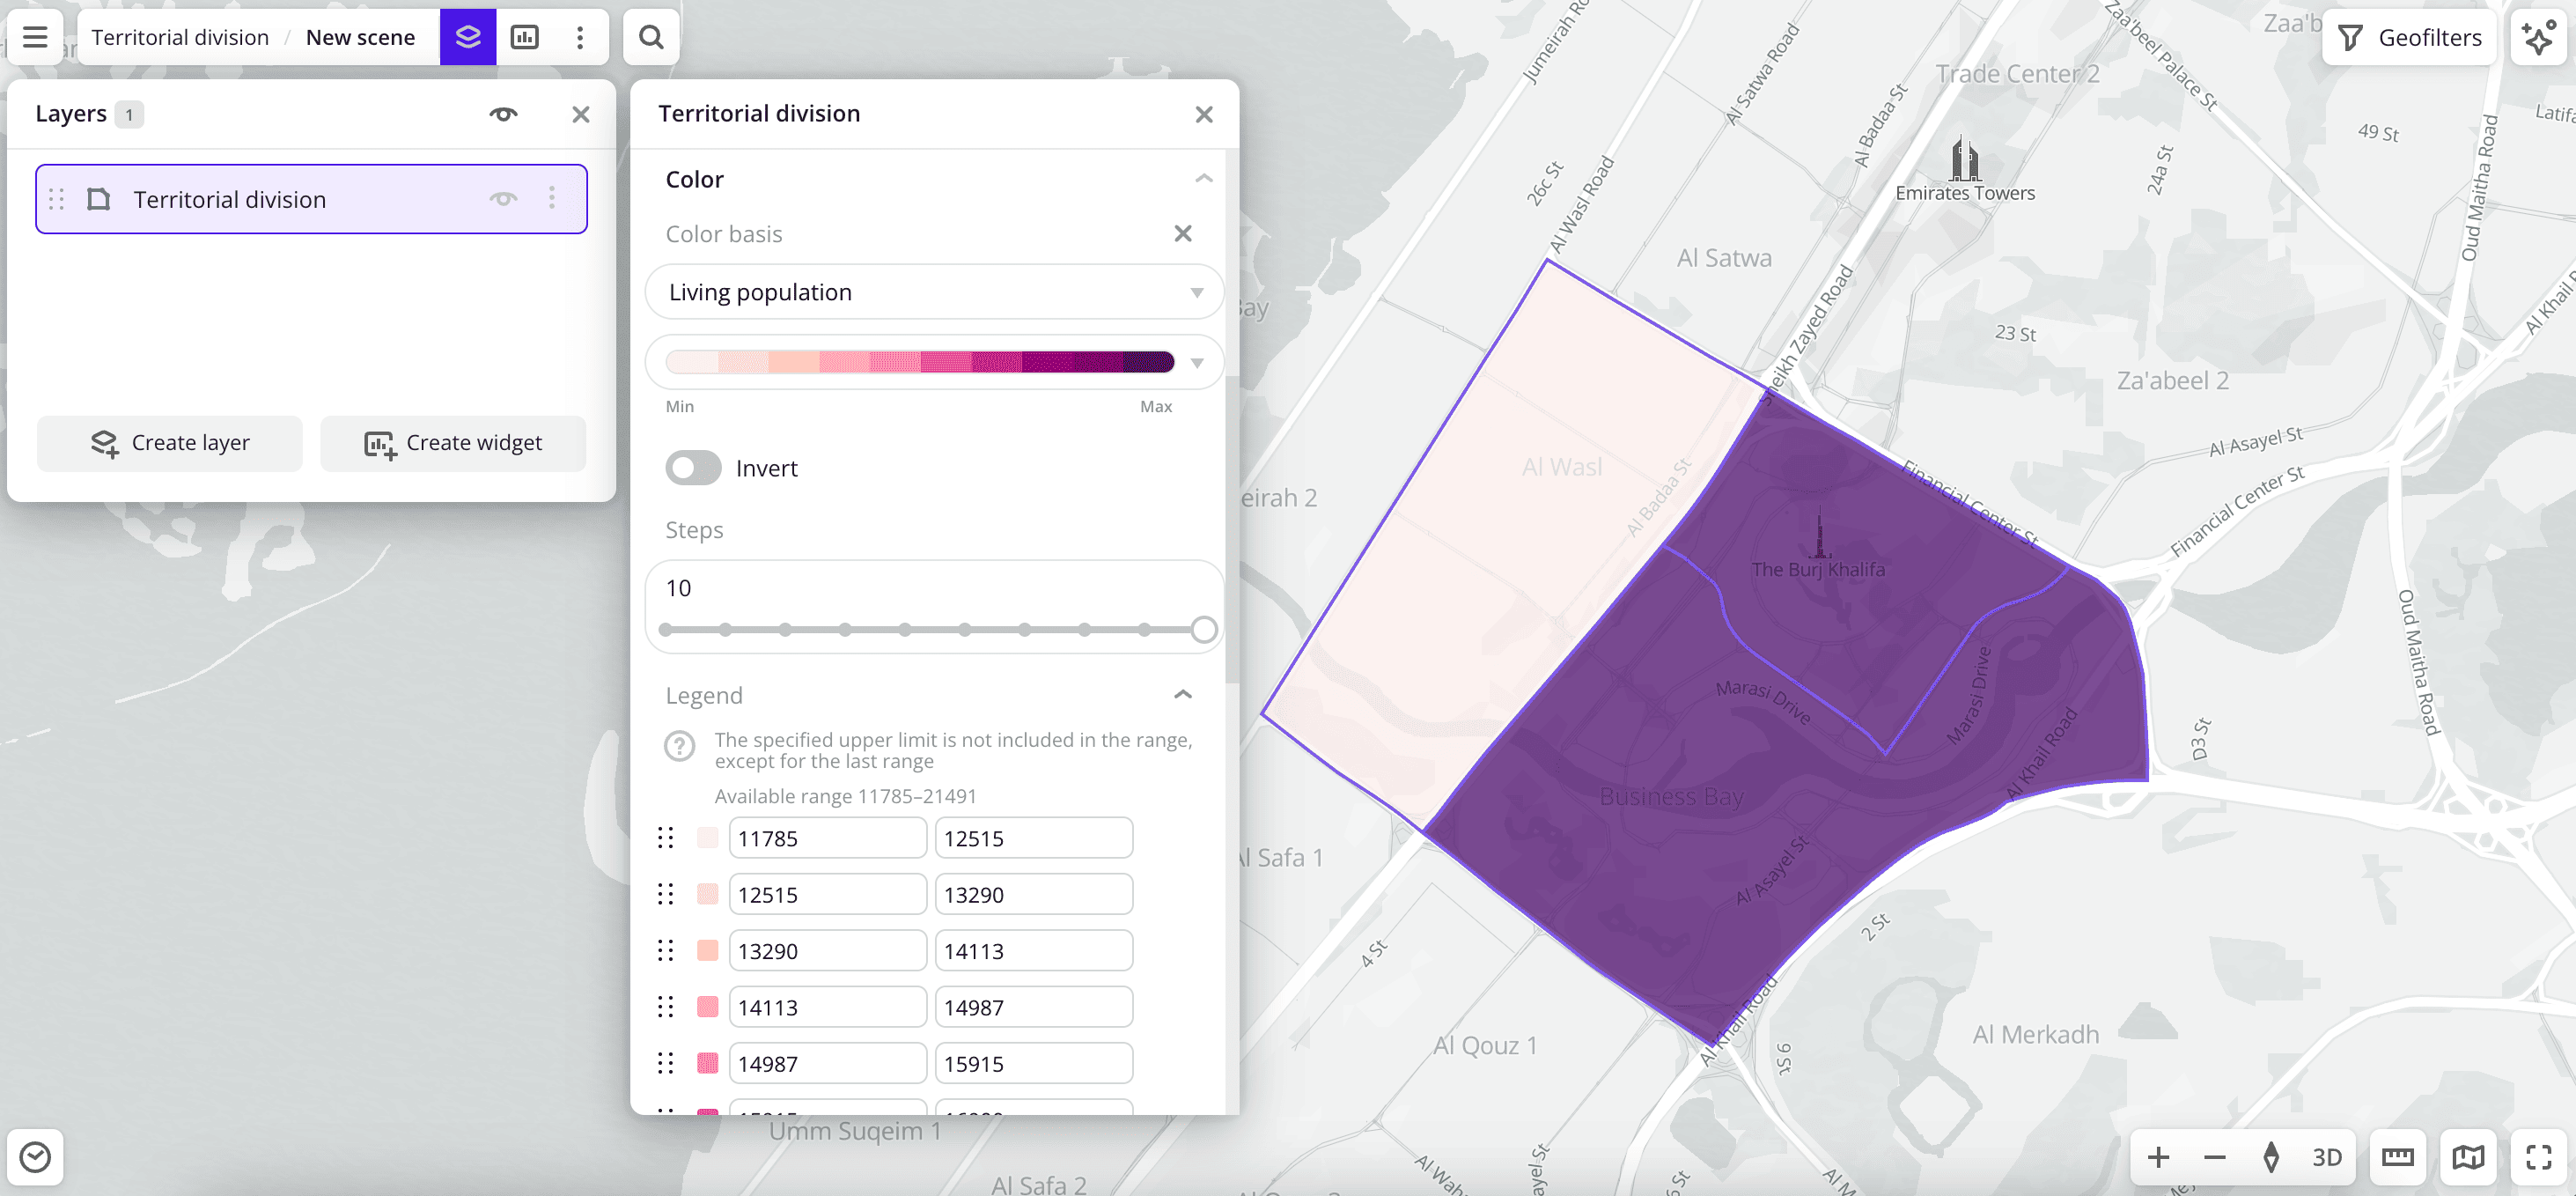
Data purchasing
You can purchase data separately as an export in the following formats:
- Table formats:
.csv.txt.json
- Formats for storing geographic data:
.shp(Shape).gpkg(GeoPackage).geojson(GeoJSON)
For more information about the price, available territories, and how to purchase data, fill out the form on urbi.ae.
What's next?
- Quick start.
- Get to know more about other Data categories.
- Get to know how to work with Data visualization.
- Get to know more about Layers, Dashboards, Scenes, and Widgets.
- Get to know prepared Analytics presets.