Legend
With the Legend widget, you can view information about the data for layers added to the dashboard scene. The widget is automatically created when the scene is created, and any changes to the layer data (e.g., modifying the sample) are reflected in the legend.
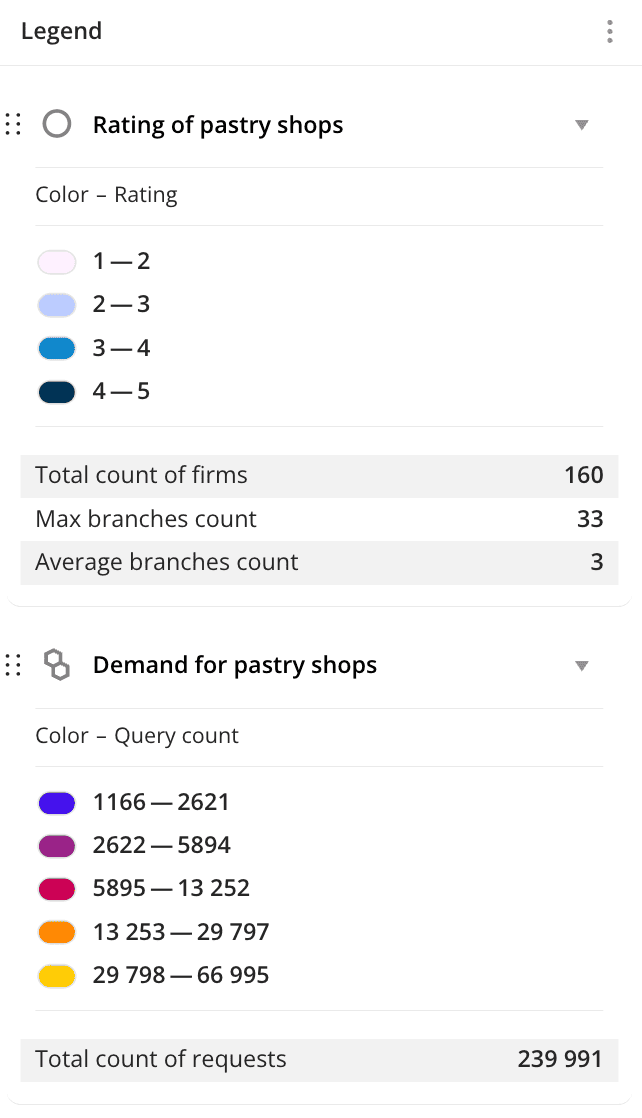
Example of the Legend widget:
Main features
-
The color scale and data ranges are inherited into the legend from the settings of the data layer visualization. If necessary, you can customize a color scale and data ranges for the legend and also change the order of the data layers in the widget.
-
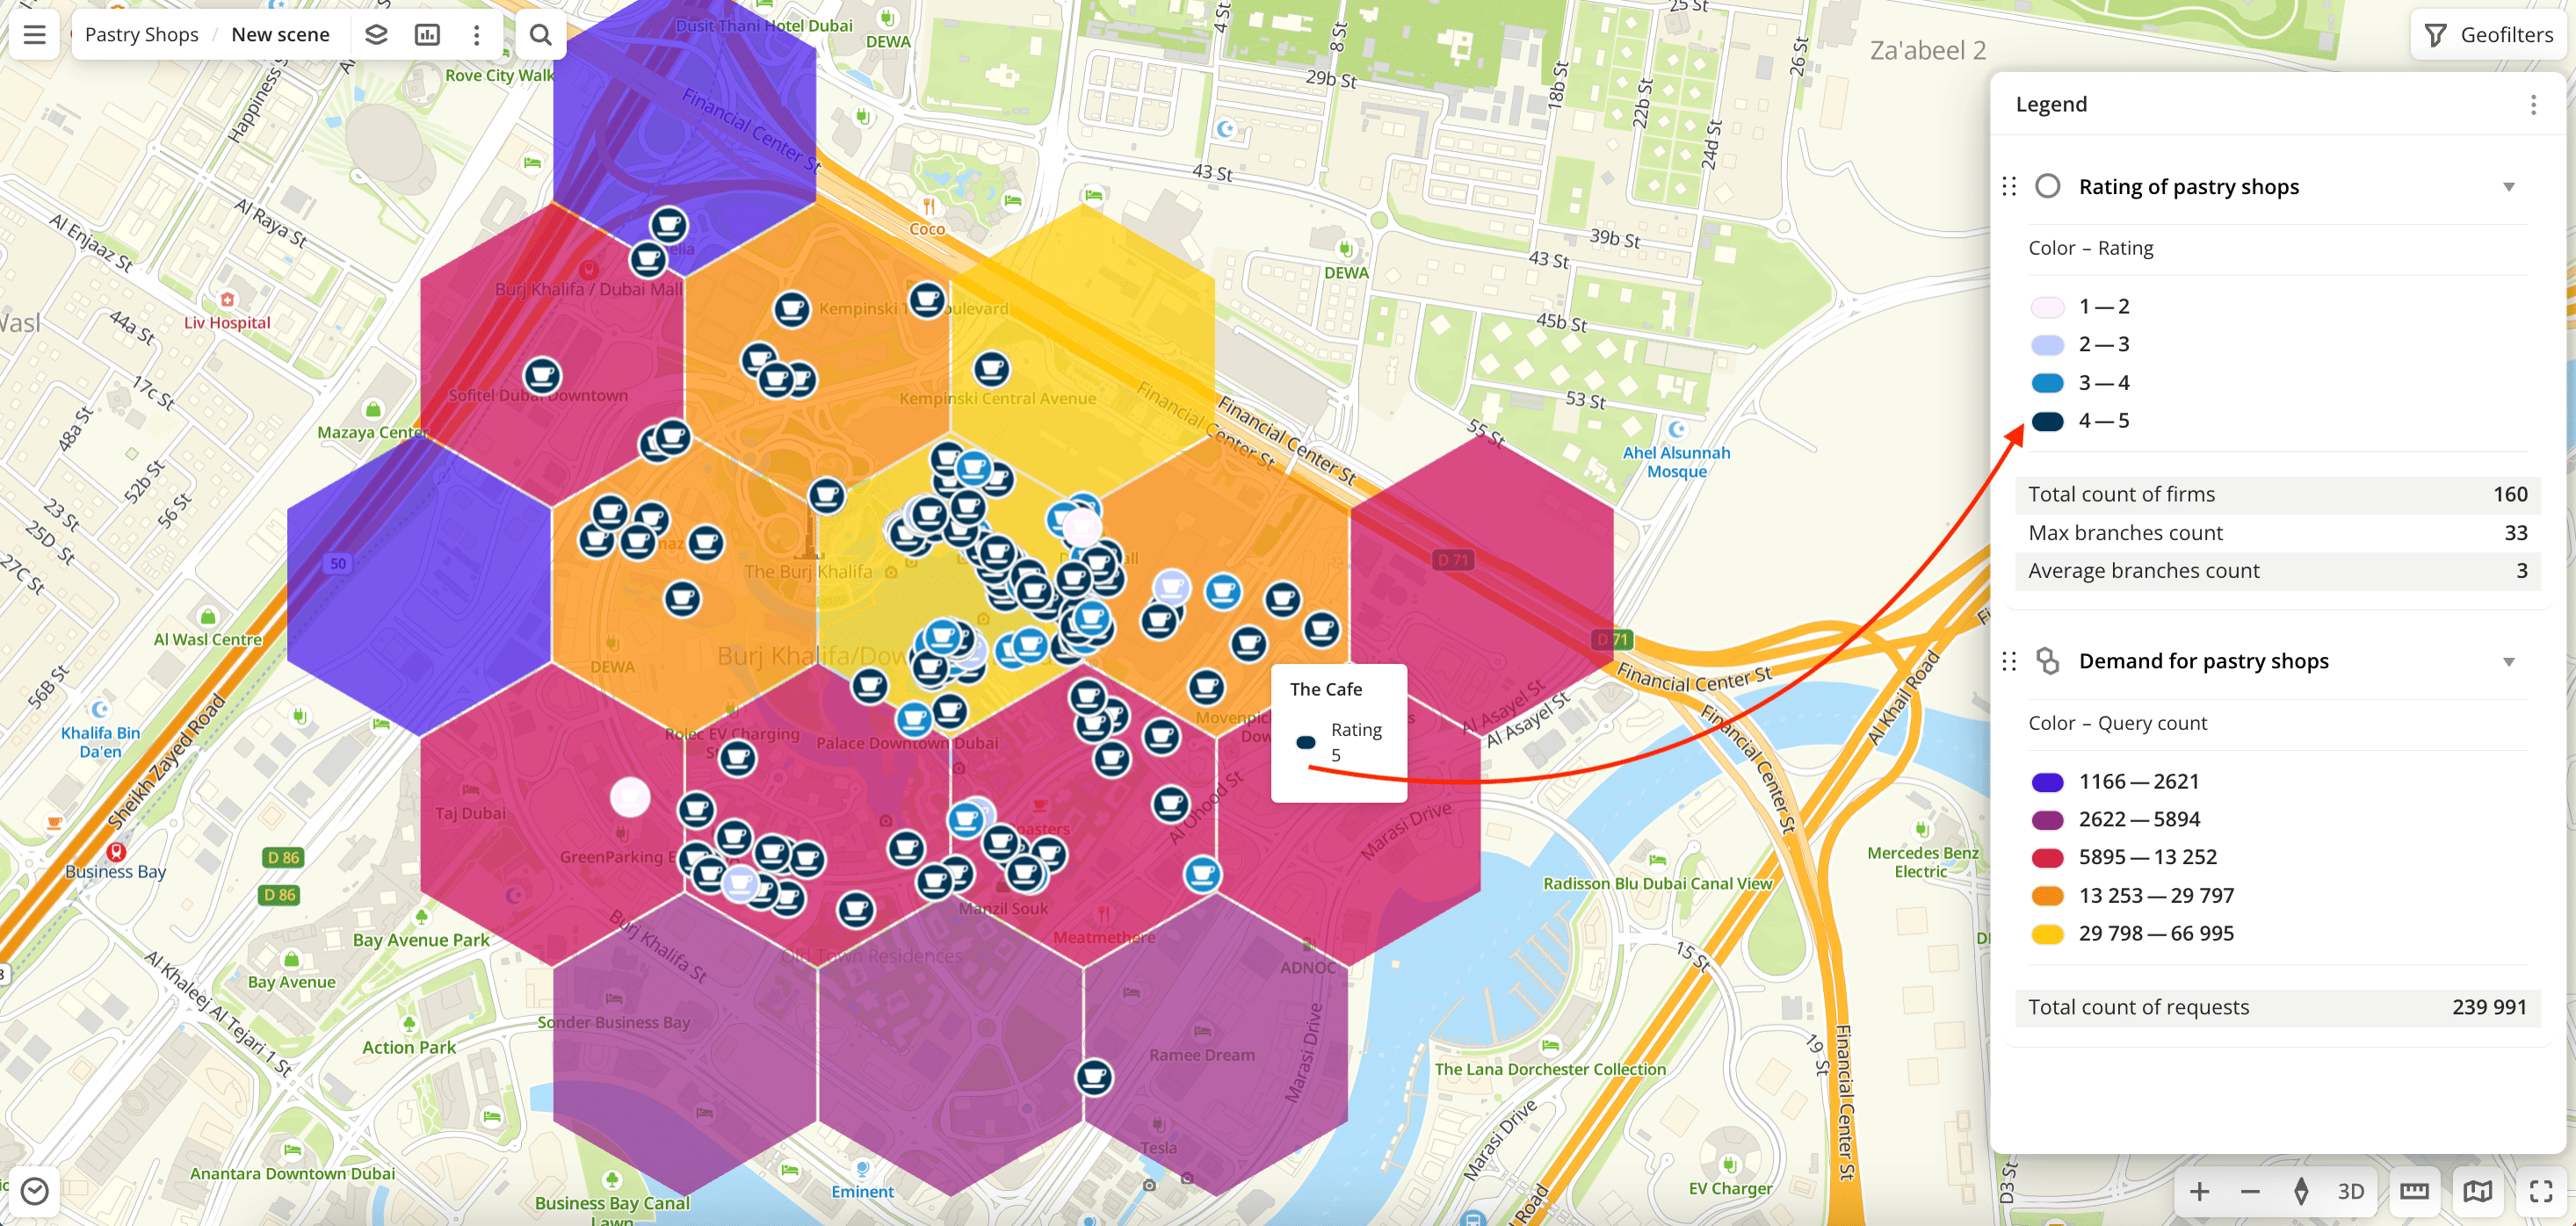
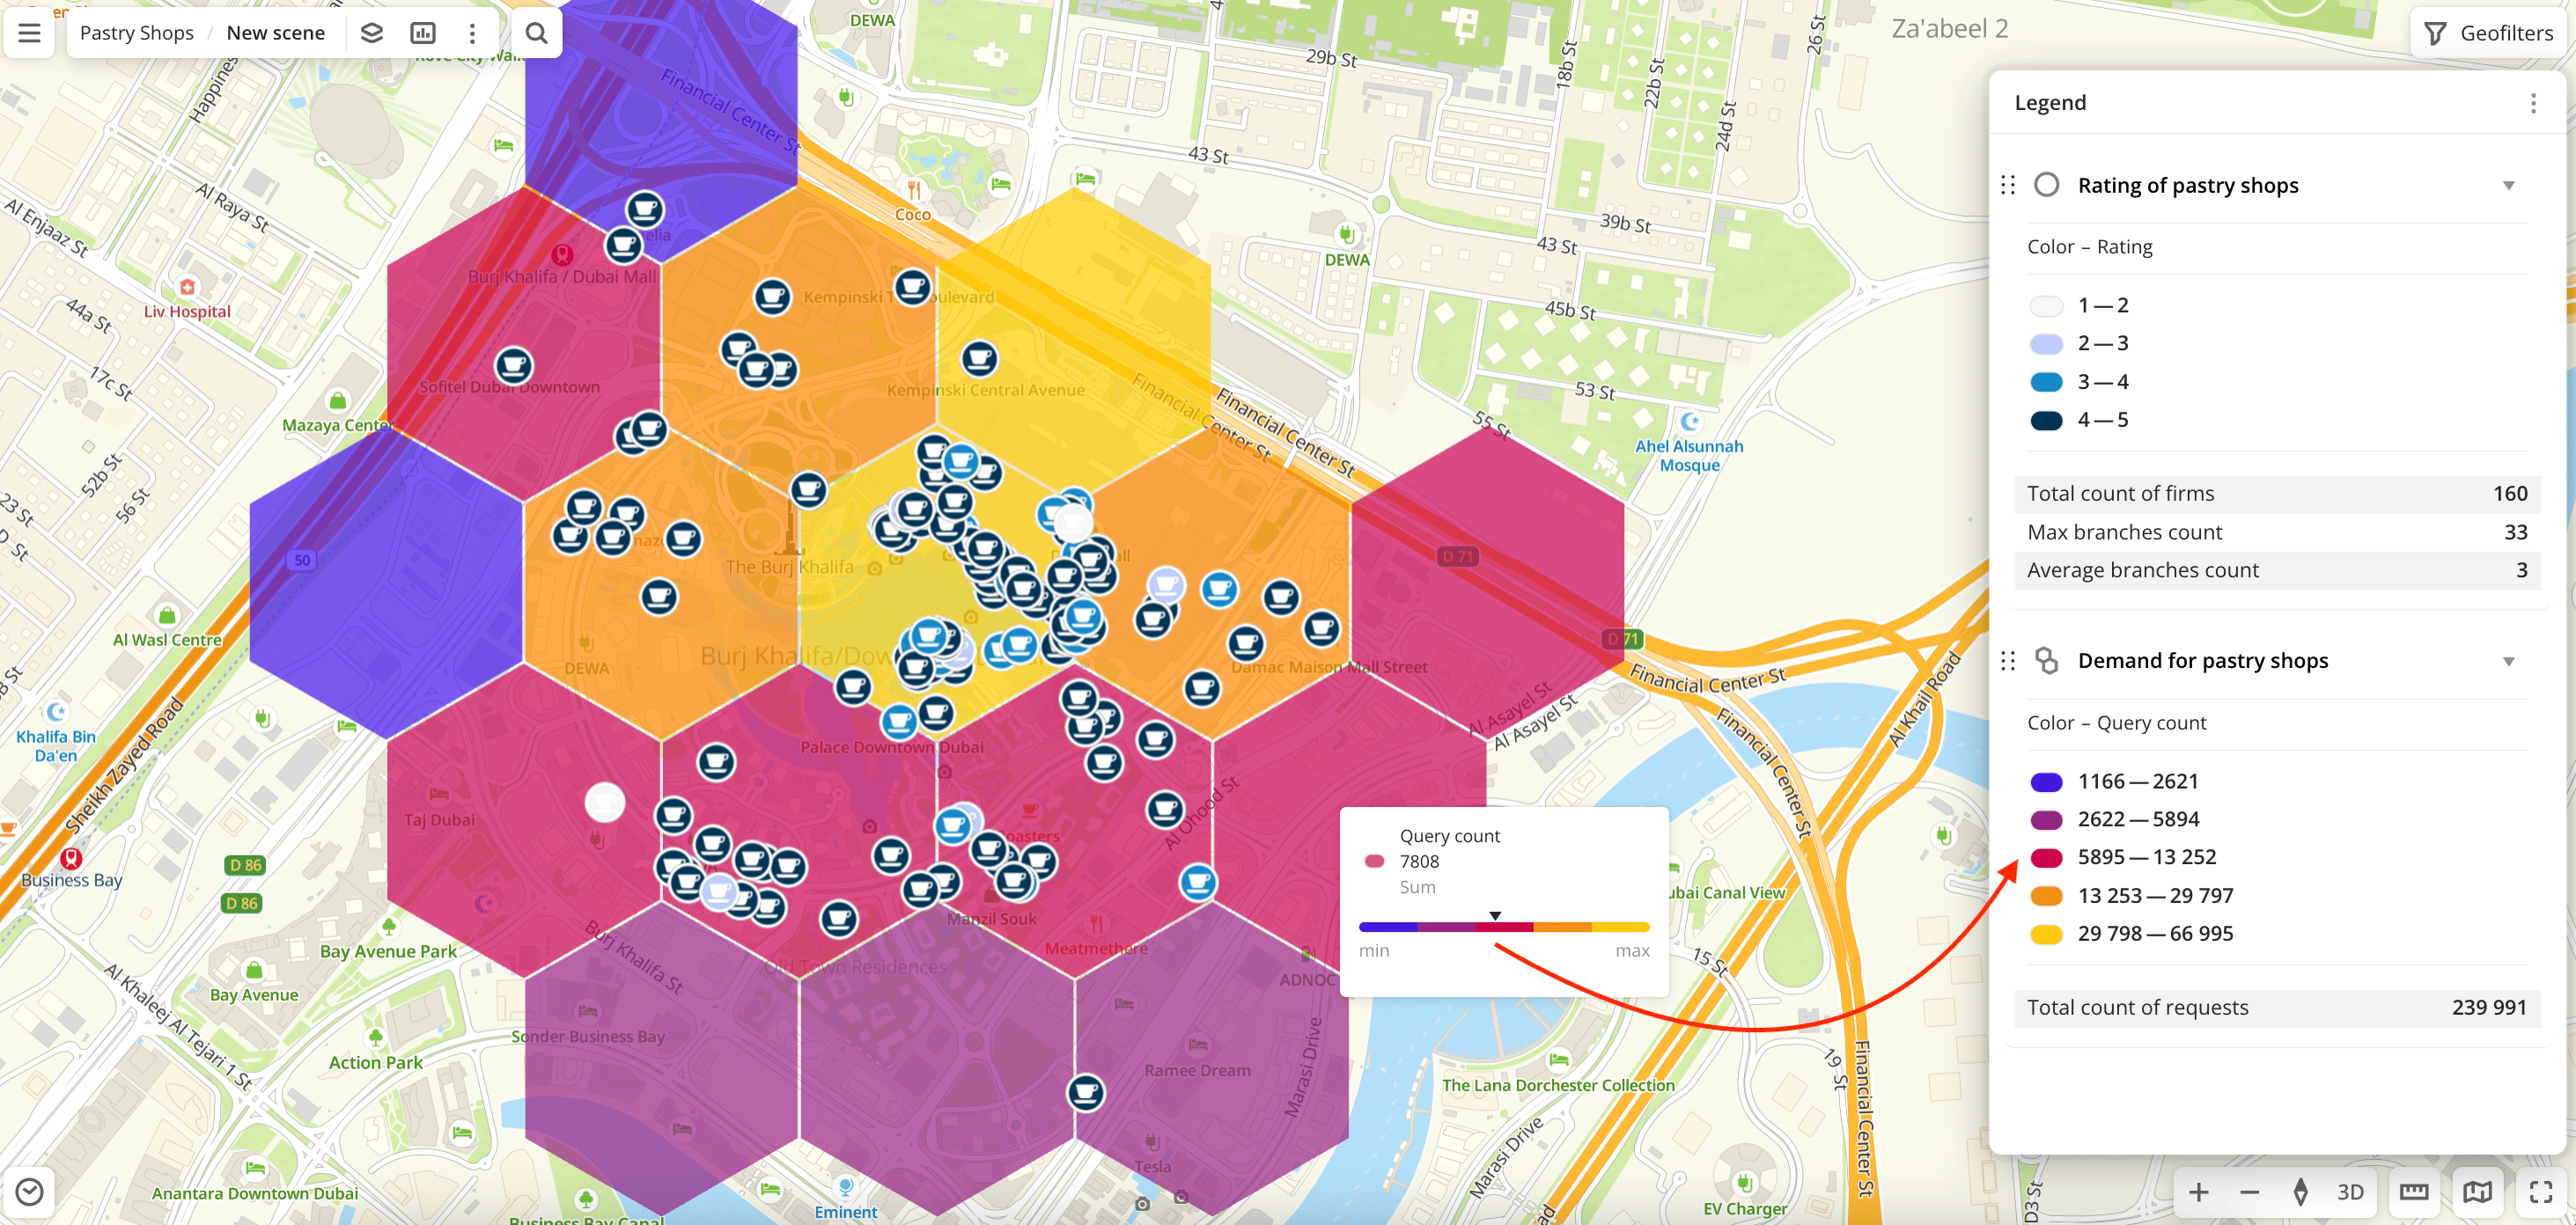
When you hover over a visualization element on the map, a tooltip with the legend is displayed:
-
If the filtering by territories or data attributes is applied on a dashboard scene, only the values that match the filters are displayed in the widget. For more information, see the Filtering data on a dashboard instruction.
Customizing a color scale and data ranges for the legend
You can customize a color scale and data ranges for the legend by modifying the layer visualization settings. Customization of ranges is not available for the Heatmap visualization method.
- Go to the Dashboards tab.
- Open the required dashboard.
- Open a scene using the arrows
 and
and  . If there is only one scene in the dashboard, it opens automatically when you open the dashboard.
 - To open a layer, click
 icon and select the required layer.
 - Set the legend parameters.
Parameters
For the legend customizing, the following parameters are available:
-
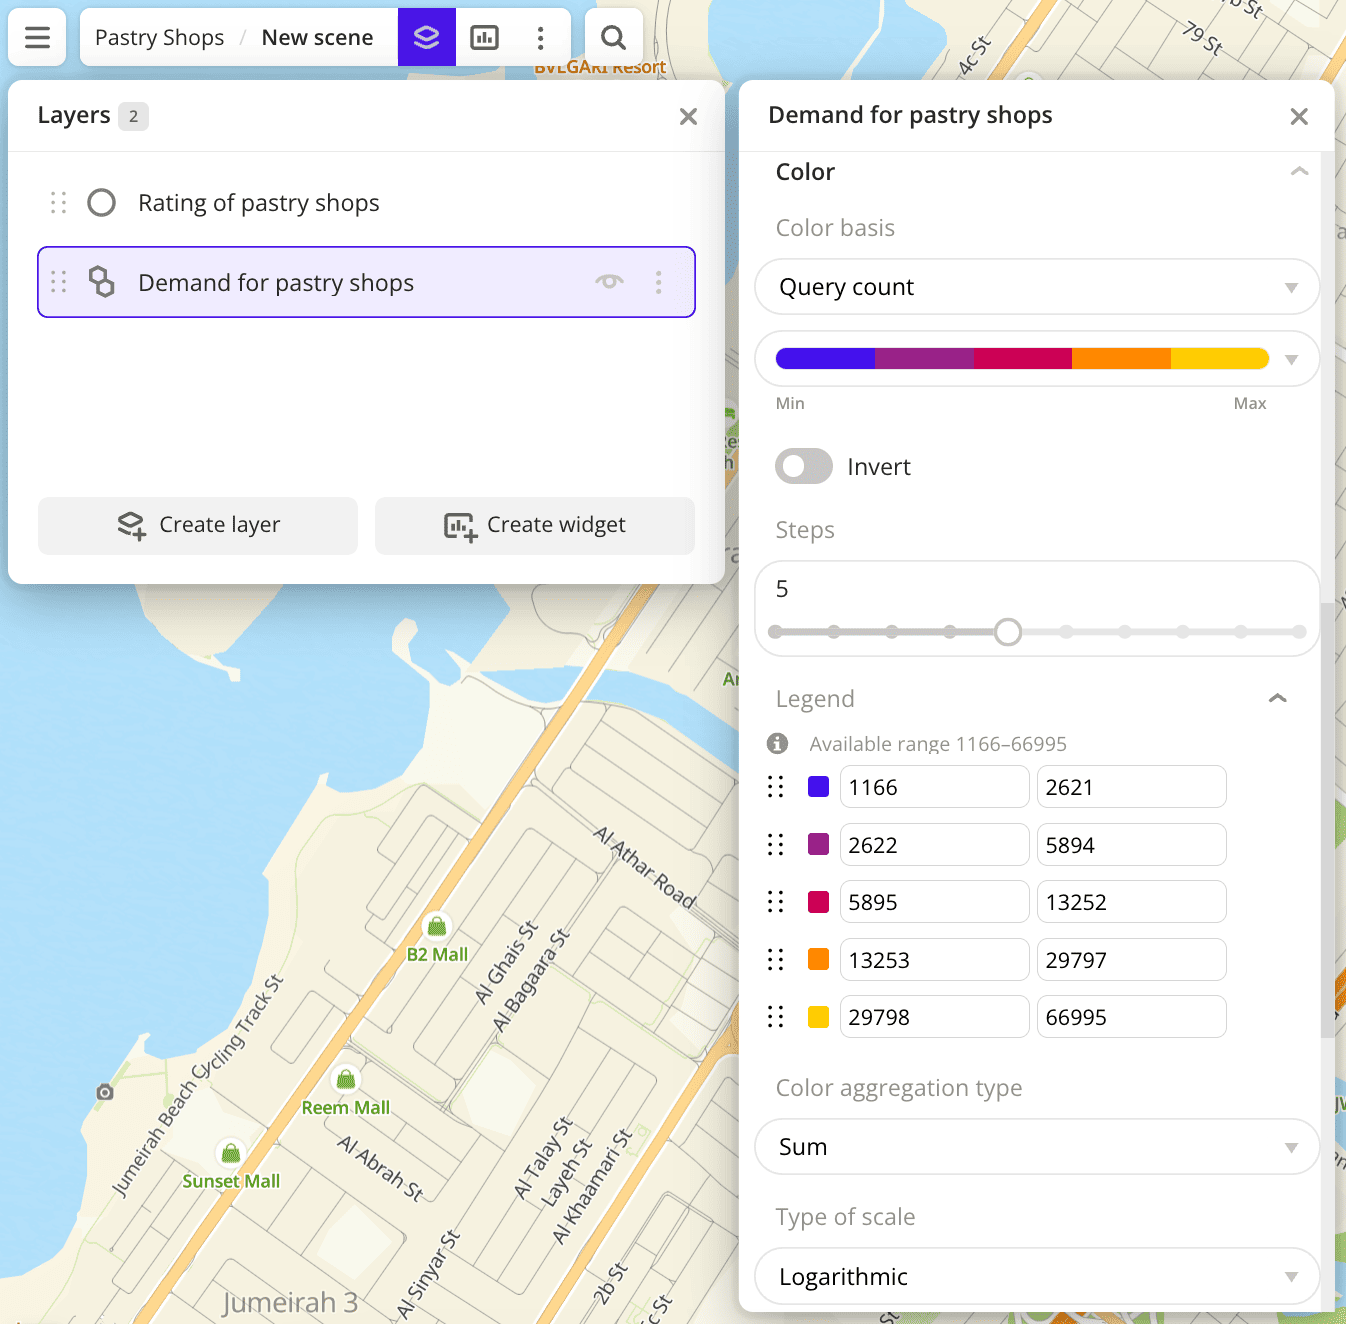
Color basis: attribute based on which the elements on the map and in the legend are colored according to the color scale. The available values depend on the data in the sample.
-
Color scale: set of prepared color samples.
-
Invert: select to invert the selected color scale.
-
Steps: number of steps in the color scale of the legend from
1to10. -
Legend: configuring of data ranges in the legend. Ranges are calculated automatically depending on a type of scale (for
Logarithmic,Linear, andExponentialtypes). You can also customize ranges manually by entering the required range limits or changing the order and number of ranges (Adjustabletype). The specified upper (right) limit is not included in the range. The maximum number of ranges is 10.
To change the order of ranges, hold down icon next to the required range and drag it. To add a range, click
  icon. To delete a range, click
  icon.
icon. -
Type of scale: distribution type used to calculate data ranges in the legend. Available only for numeric attributes:
Logarithmic- logarithmic distribution. Suitable for displaying data that changes over a wide range or differs by several orders of magnitude.Linear- uniform distribution. Suitable for displaying values of the same order.Exponential- exponential distribution. Suitable if you need to highlight small values and ignore large ones, and also for displaying data that changes quickly.Adjustable- manual configuring of ranges. In all ranges except the last one, the specified upper (right) limit is not included in the range.
Changing the order of data layers in the legend
By default, the data layer blocks in the Legend widget are displayed in the order they are arranged in the scene. You can customize the order of the layers in the legend without changing the order in the layer list. For example, if you need to show specific layers at the top of the legend.
- Go to the Dashboards tab.
- Open the required dashboard.
- Open a scene using the arrows and . If there is only one scene in the dashboard, it opens automatically when you open the dashboard.
- If the legend is not displayed on the map, in the top menu of the dashboard, click
 icon. In the list of widgets, select the checkbox (
 ) for the legend or click
  icon and select Show on map.
 - Hold down icon for the required layer and drag it.
What's next?
- Get to know more about other Widgets types.
- See available Operations with widgets.
- Quick start.
- Get to know how to work with Data and Data visualization.
- Get to know more about Layers, Dashboards, and Scenes.
- Get to know prepared Analytics presets.