KPI
A KPI widget allows you to display the following indicators on dashboard scenes:
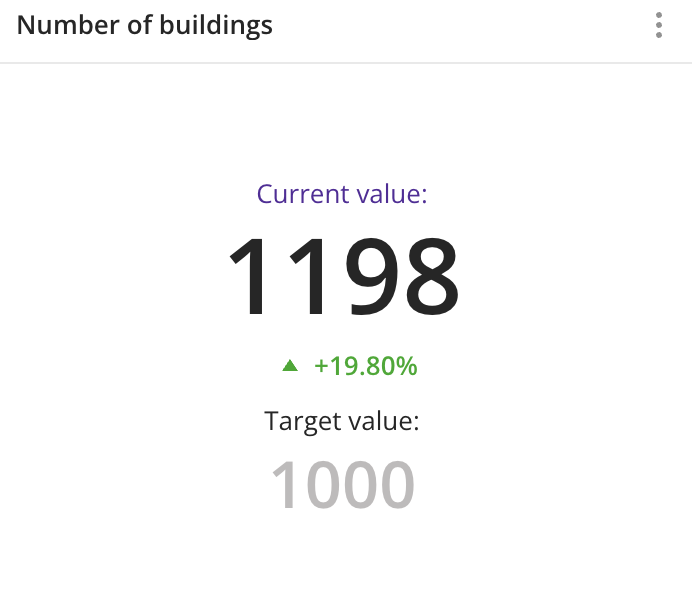
- Current value: a constant value or a value of a selected data attribute (e.g., average rating or the number of constructed buildings).
- Target value.
- Difference between the current and the target values.
Use the KPI widget to monitor KPIs and important metrics such as a sales plan progress, an average rating, or population change.
Case example: track progress in the number of constructed buildings:
Main features
-
You can display only a current value in the widget or enable the display of a target value and the difference between them.
-
As a current and a target values, you can use:
-
Constant values that are entered manually and do not depend on the layer data.
-
Data attribute values from the layer, which are updated automatically when the layer data changes. As attributes, you can use:
- Numeric attributes: to count the number of values in the sample or to count values of the attributes using aggregation functions: total, mean, minimum, maximum value, median, and percentile.
- Text attributes, logical attributes, or number of objects: to count the number of values in the sample.
-
-
The current and the target values can be of different types. For example, the target value can be a constant, and the current value can be obtained from data attributes. Also, attributes for the current and the target values can belong to different data layers.
-
You can select the function to calculate the difference between the current and the target values.
-
Changes in layer data are automatically reflected in the widget.
-
If the filtering by territories or data attributes is applied on a dashboard scene, only the values that match the filters are displayed in the widget. For more information, see the Filtering data on a dashboard instruction.
Creating a widget
-
Go to the Dashboards tab.
-
Open the required dashboard.
-
Open a scene using the arrows
 and
and  . If there is only one scene in the dashboard, it opens automatically when you open the dashboard.
 -
In the top menu of the dashboard, click
 icon.
icon. -
Select the KPI widget type.
-
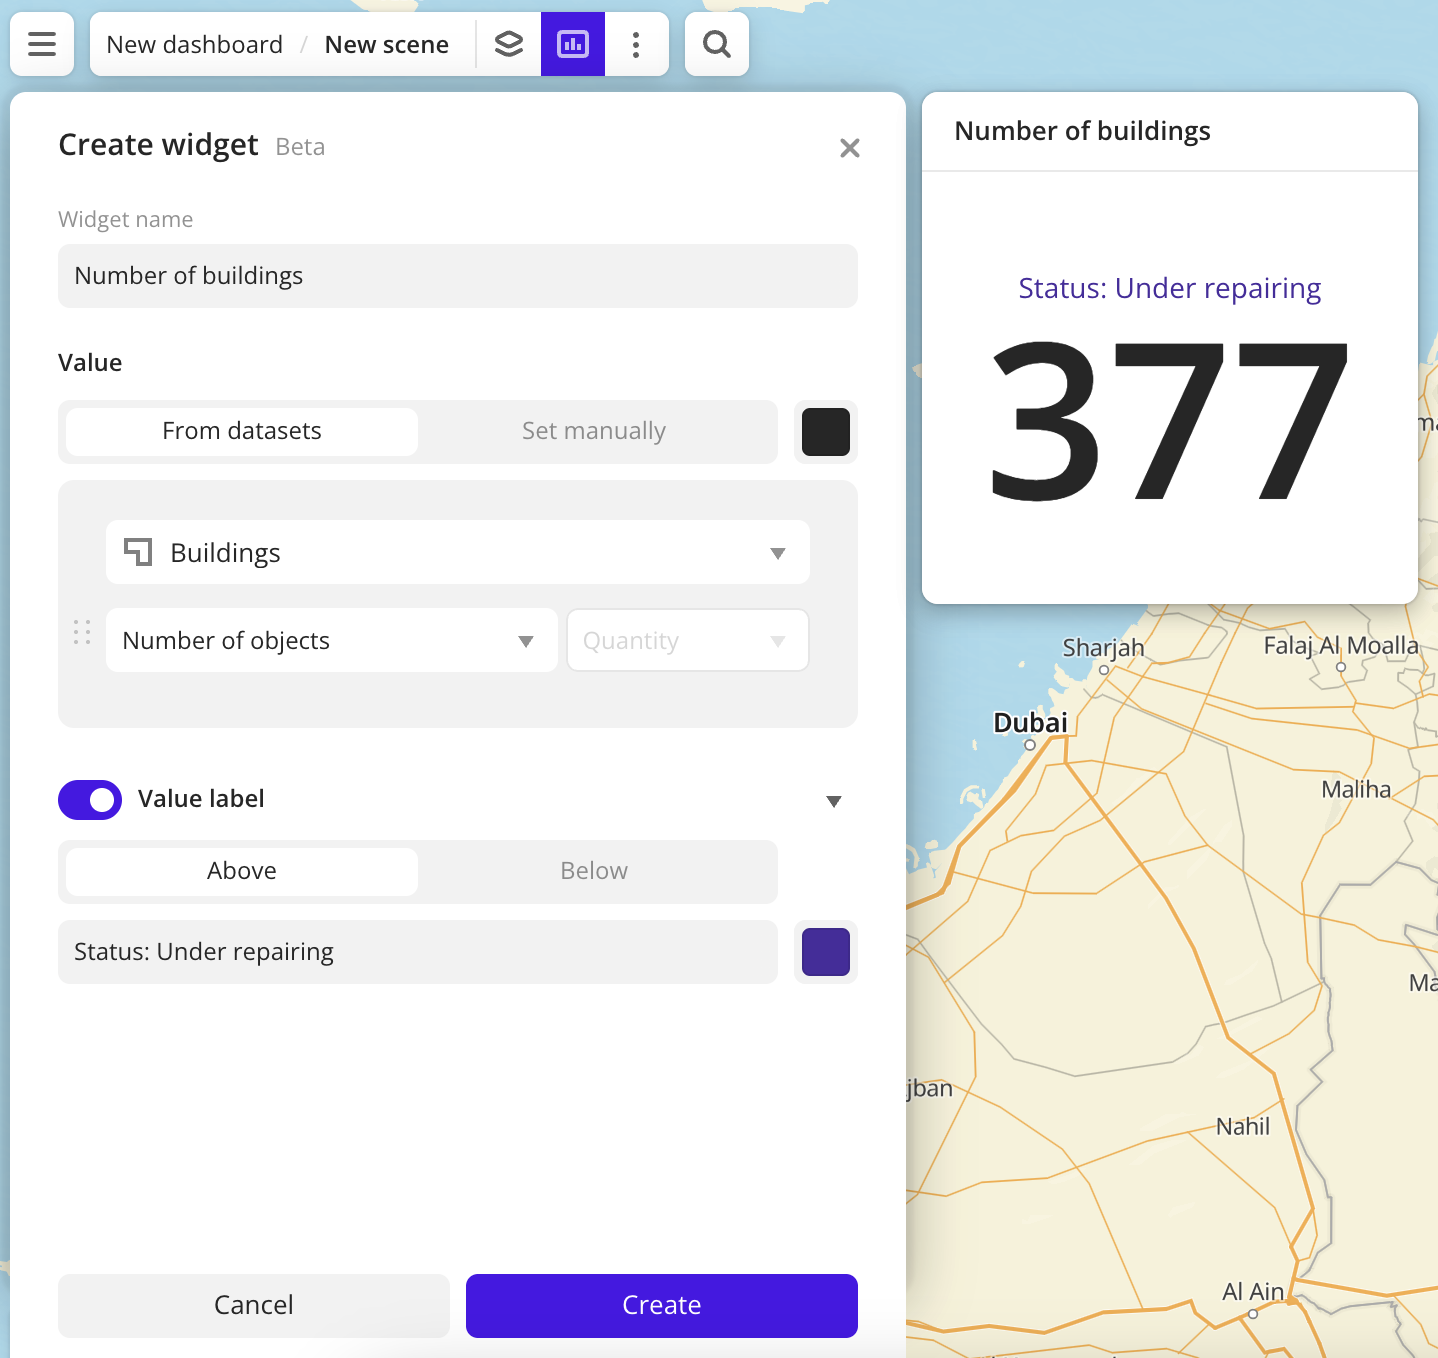
Specify the required parameters. In the Value block, select the current value to display in the widget:
- From datasets: selecting an attribute from the dataset (the value in the widget is updated when the data changes):
- Layer: data layer containing the required attribute.
- Aggregation attribute: attribute used to aggregate data and calculate the value.
- Aggregation type: function used to calculate the attribute value.
- Set manually: entering the constant value manually.
- From datasets: selecting an attribute from the dataset (the value in the widget is updated when the data changes):
-
Set the remaining widget parameters if necessary.
-
Click Create.
The new widget is automatically added to the selected dashboard scene.
Note
When working with the uploaded data, make sure it contains at least one attribute to display a value in the widget.
Parameters
General widget settings
Parameter |
Description |
|---|---|
| Widget name | Widget name. |
Current value
Current value label:
Parameter |
Description |
|---|---|
| Label | Label text in the widget above the value. The maximum number of characters is 100. |
| Label color | Color of the label above the value. Select a color from the palette or specify it in the HEX format. |
Selecting a current value (From datasets tab):
Parameter |
Description |
|---|---|
| Layer | Data layer containing the required attribute. |
| Aggregation attribute | Attribute, which value is aggregated and displayed in the widget:
When the data value changes, the value in the widget is also updated automatically. |
| Aggregation type | Function used to calculate the attribute value. For numeric attributes:
For text attributes, logical attributes, and number of objects:
|
| Value color | Color of the current value in the widget. Select a color from the palette or specify it in the HEX format. |
Entering a current value manually (Set manually tab):
Parameter |
Description |
|---|---|
| Value | Constant value that is not changed until you specify a new one when editing the widget. The maximum number of characters is 16. |
| Value color | Color of the value in the widget. Select a color from the palette or specify it in the HEX format. |
Target value
Target value label:
Parameter |
Description |
|---|---|
| Label | Label text in the widget above the value. The maximum number of characters is 100. |
| Label color | Color of the label above the value. Select a color from the palette or specify it in the HEX format. |
Selecting a target value (From datasets tab):
Parameter |
Description |
|---|---|
| Layer | Data layer containing the required attribute. |
| Aggregation attribute | Attribute, which value is aggregated and displayed in the widget:
When the data value changes, the value in the widget is also updated automatically. |
| Aggregation type | Function used to calculate the attribute value. For numeric attributes:
For text attributes, logical attributes, and number of objects:
|
| Value color | Color of the target value in the widget. Select a color from the palette or specify it in the HEX format. |
Entering a target value manually (Set manually tab):
Parameter |
Description |
|---|---|
| Value | Constant value that is not changed until you specify a new one when editing the widget. The maximum number of characters is 16. |
| Value color | Color of the value in the widget. Select a color from the palette or specify it in the HEX format. |
Difference
Parameter |
Description |
|---|---|
| Calculation method | Function used to calculate the change in the current value relative to the target value:
|
| Indicator icons | Color settings of the icons that show the change in the current value relative to the target value. Select a color from the palette or specify it in the HEX format. Icon display rules:
|
What's next?
- Get to know more about other Widgets types.
- See available Operations with widgets.
- Quick start.
- Get to know how to work with Data and Data visualization.
- Get to know more about Layers, Dashboards, and Scenes.
- Get to know prepared Analytics presets.