Car traffic (aggregated)
The Car traffic (aggregated) data category provides information on average hourly car traffic. Traffic is grouped by days of the week and months. The data is updated every month.
The information on traffic is based on Urbi navigator data.
Overview
To get started:
- Go to the Main or Data tab.
- Select the Car traffic data category.
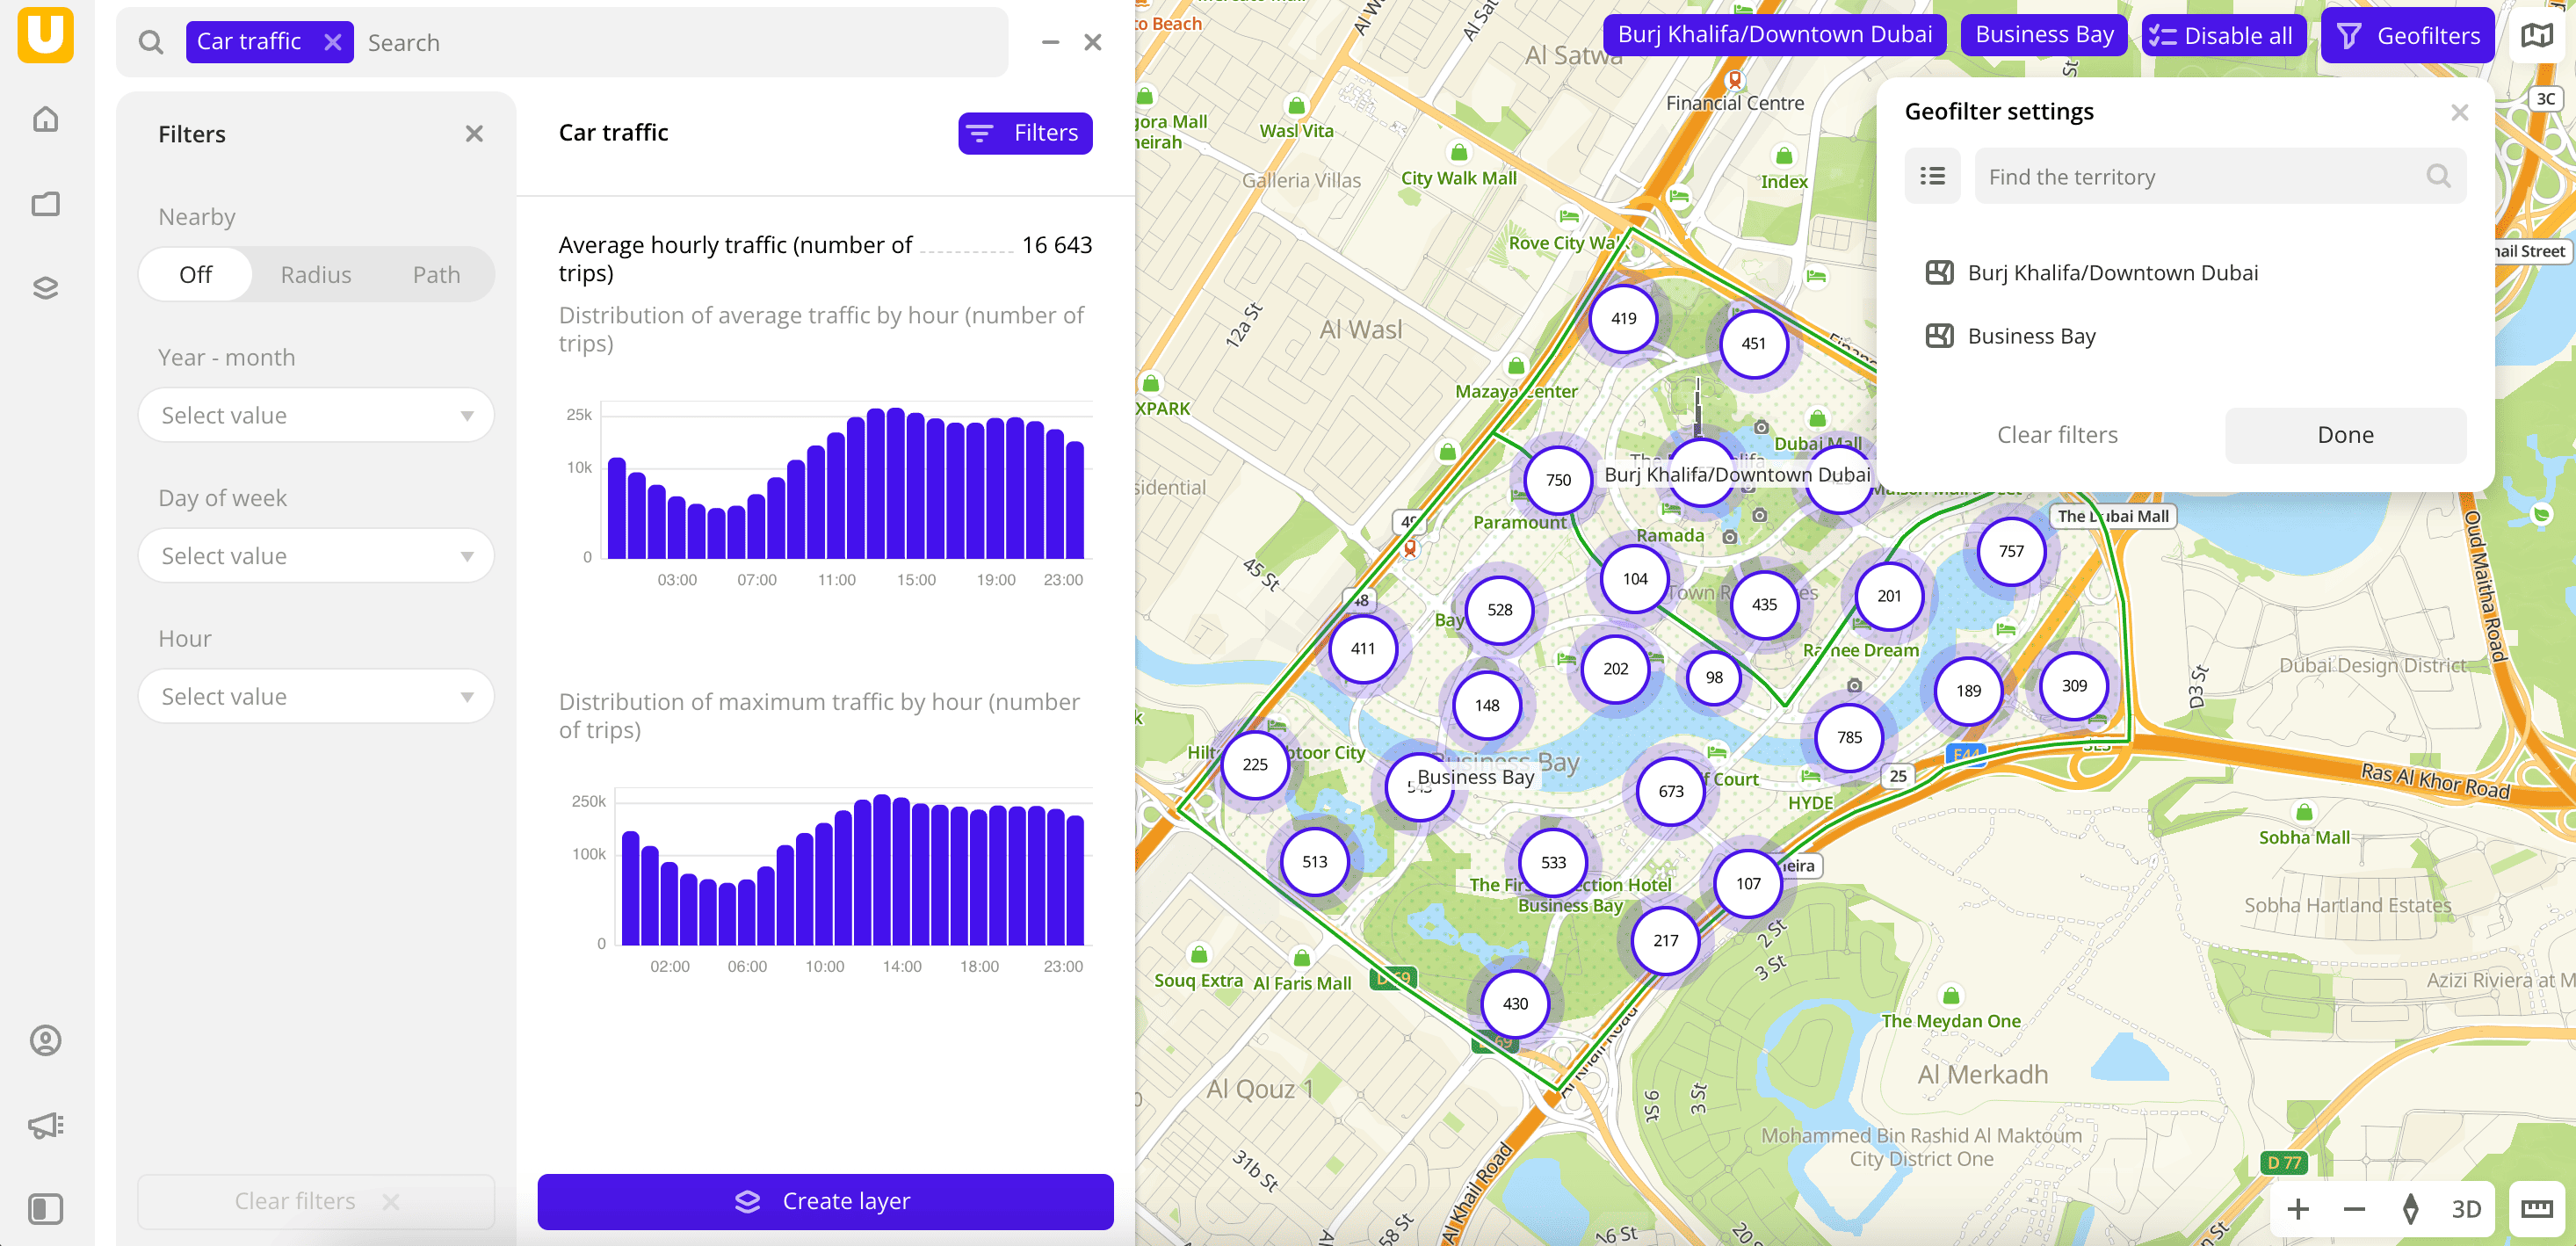
- In the Geofilter settings dialog, select up to 50 territories for which the data sample is created. You can use standard and custom territories, and also build proximity zones and circles on the map. For more information, see the Geofilters section. After you select the territories, click Done.
- On the Filters tab, set the remaining filters if necessary.
The data is visualized on the map as centroid points: the centers of the object geometries. The following filtering results are available:
- Total count of registered trips.
- Distribution of average and maximum traffic by hour.
To save this data sample and customize its visualization (e.g., as a heatmap), click Create layer.
Filters
For the Car traffic (aggregated) category, the following filters are available:
- Year-month: year and month to display traffic. You can select multiple options.
- Day of week: day of the week to display traffic. You can select multiple options.
- Hour: hour to display traffic. You can select multiple options.
To reset the parameter filter, click ![]() icon next to the filter name. To reset all parameter filters, click Reset filters at the bottom of the tab.
icon next to the filter name. To reset all parameter filters, click Reset filters at the bottom of the tab.
To hide the filter by territory, in the Geofilter settings dialog, click ![]() icon next to the geofilter name. To delete the geofilter, click
icon next to the geofilter name. To delete the geofilter, click ![]() icon next to its name. To delete all geofilters, click Clear filters.
icon next to its name. To delete all geofilters, click Clear filters.
Visualization
Important
For the H3 visualization method, you must set the Resolution parameter to
10so that data is displayed correctly.
What's next?
- Quick start.
- Get to know more about other Data categories.
- Get to know how to work with Data visualization.
- Get to know more about Layers, Dashboards, Scenes, and Widgets.
- Get to know prepared Analytics presets.