Viewport GeoJSON with WFS
GeoJsonViewportSource allows you to display data in GeoJSON format by requesting it for the current viewport of the map.
Displaying data on the map
As an example, you can use WFS data from GeoServer.
Note
The WFS standard is used not only to query data but also to modify it. The
GeoJsonViewportSourceobject supports only data displaying.
To display data on the map, follow the steps below:
- Get WFS data using GeoServer.
- Add layers to the map style.
- Connect the WFS data source to the map.
1. Get WFS data from GeoServer
-
Install and run GeoServer as a Docker container:
docker pull docker.osgeo.org/geoserver:2.26.x
docker run -it -p8080:8080 --env CORS_ENABLED=true docker.osgeo.org/geoserver:2.26.x
Note
The variable
CORS_ENABLED=trueis added to the run command only for the example of this article.See the full installation instruction for the latest version of GeoServer.
-
On the web interface, go to the
http://localhost:8080/geoserverpage. -
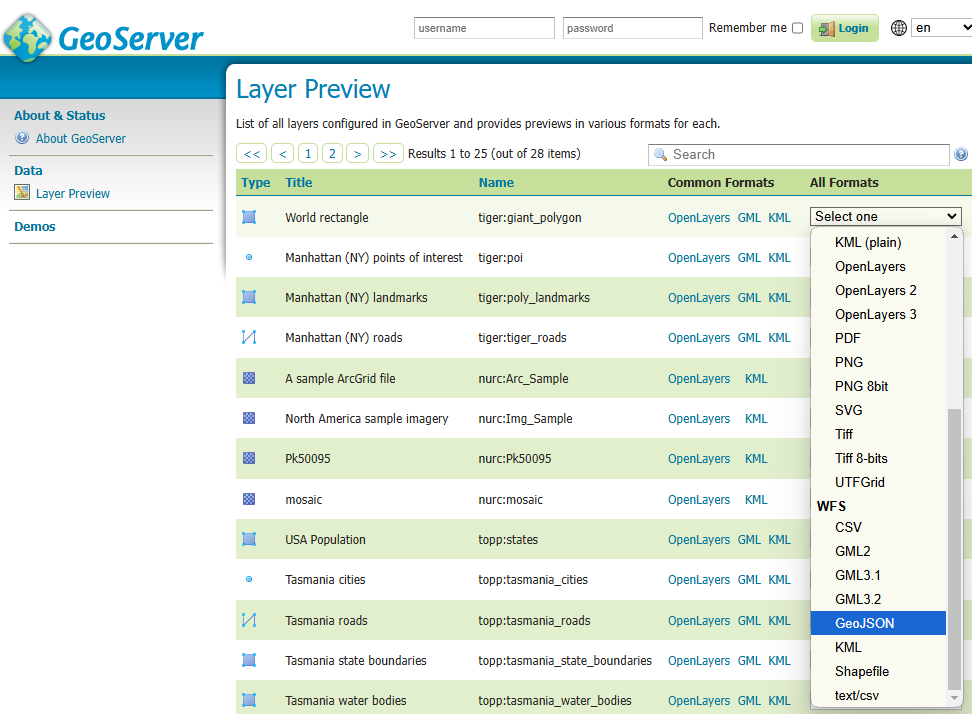
Go to the Layer Preview section. For the required layer, in the All Formats column, select WFS → GeoJSON:

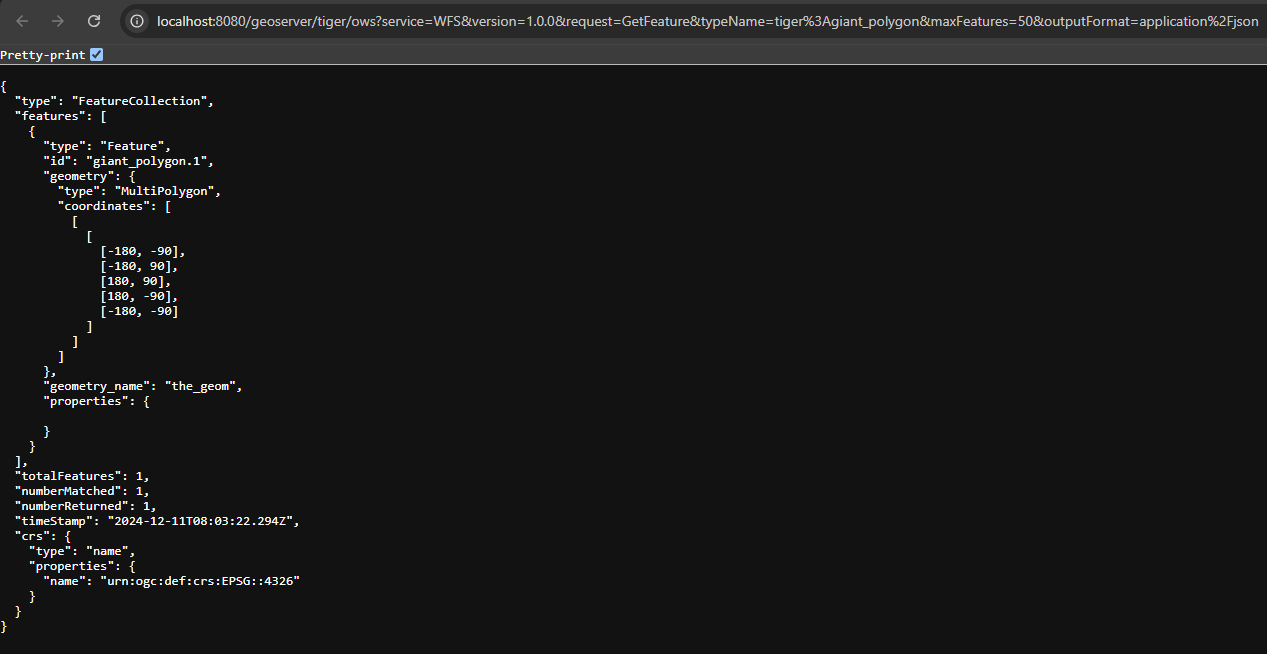
In the new tab, a URL of the request with the GetFeature type for getting data is opened:

Using this base URL, you will create a bbox source function when connecting data sources. The function is used in the data option of GeoJsonViewportSource and the setData method.
2. Add style layers
Add three new layers using addLayer to display polygons, lines, and points on the map:
const layers = [
    {
        type: 'polygon',
        id: 'geojson-polygon',
        filter: ['match', ['sourceAttr', 'exampleCase'], ['polygon'], true, false],
        style: {
            strokeWidth: 2,
            strokeColor: '#444444',
            color: '#00ff00a0',
        },
    },
    {
        type: 'line',
        id: 'geojson-line',
        filter: ['match', ['sourceAttr', 'exampleCase'], ['line'], true, false],
        style: {
            color: '#9e02e0',
            width: 5,
        },
    },
    {
        type: 'point',
        id: 'geojson-point',
        filter: ['match', ['sourceAttr', 'exampleCase'], ['point'], true, false],
        style: {
            iconWidth: 16,
            textFont: ['Open_Sans', 'Open_Sans'],
            textField: ['get', 'NAME'],
            textFontSize: [16, 16],
        },
    },
];

map.on('styleload', () => {
    layers.forEach((layer) => map.addLayer(layer));
});
Layers contain attributes in the filter field, which you can specify in the next step in the attributes option of the sources.
3. Connect data sources
As a data option, GeoJsonViewportSource gets a bbox function that returns a URL for requesting data.
Connect sources for each created layer and set navigation to the required location on the map:
const WFS_POINTS_DATA_FN = (bbox: number[]) =>
    `http://localhost:8080/geoserver/tiger/ows?service=WFS&version=1.0.0&request=GetFeature&typeName=tiger%3Apoi&maxFeatures=200&outputFormat=application%2Fjson&bbox=${bbox}&srcName=EPSG:4326`;
const WFS_LINES_DATA_FN = (bbox: number[]) =>
    `http://localhost:8080/geoserver/tiger/ows?service=WFS&version=1.0.0&request=GetFeature&typeName=tiger%3Atiger_roads&maxFeatures=200&outputFormat=application%2Fjson&bbox=${bbox}&srcName=EPSG:4326`;
const WFS_POLYGONS_DATA_FN = (bbox: number[]) =>
    `http://localhost:8080/geoserver/tiger/ows?service=WFS&version=1.0.0&request=GetFeature&typeName=tiger%3Apoly_landmarks&maxFeatures=200&outputFormat=application%2Fjson&bbox=${bbox}&srcName=EPSG:4326`;

const points = new mapgl.GeoJsonViewportSource(map, {
    data: WFS_POINTS_DATA_FN,
    attributes: { exampleCase: 'point' },
});

const lines = new mapgl.GeoJsonViewportSource(map, {
    data: WFS_LINES_DATA_FN,
    attributes: { exampleCase: 'line' },
});

const polygons = new mapgl.GeoJsonViewportSource(map, {
    data: WFS_POLYGONS_DATA_FN,
    attributes: { exampleCase: 'polygon' },
});

map.setCenter([-74.0104611, 40.70758763]);
map.setStyleZoom(12);
Specify the following parameters:
-
For URL of the data request:
request=GetFeature: the source displays the data using a bbox function, soGetFeatureis used as the request type.maxFeatures: limit that applies to each request. If you remove this parameter, GeoServer returns all the data via the bbox.srcName=EPSG:4326: required parameter. By default, the source sends a request with a bbox with these coordinates.outputFormat=application%2Fjson: required parameter. By default, the source only works with GeoJSON.
-
data: name of the bbox function. -
exampleCase: attributes for connecting the source data and the corresponding layers that you added to thefilterfield in the previous step.
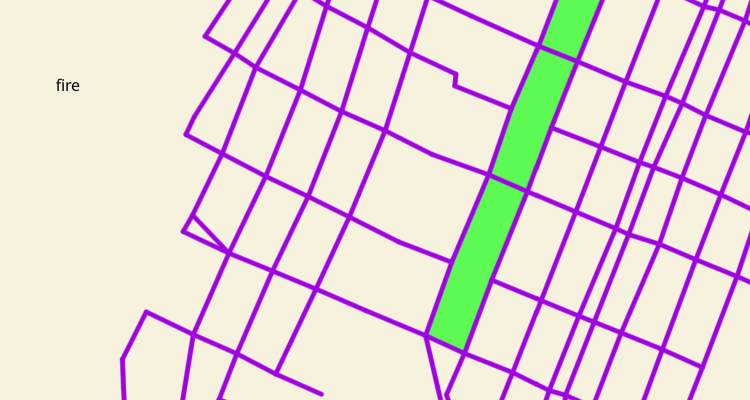
As a result, you can see the added data on the map:

Setting a new data function
You can change the bbox function that you specified in the data option in the created source using the setData method.
If the requested data changes, you may need to update the source attribute. For example, to set a bbox function to request lines for a source with point data:
points.setData(WFS_LINES_DATA_FN);
points.setAttributes({ exampleCase: 'line' });
Now you can use the data from this source in the style layer to display lines.
Expanding the requested data area
Configuring the viewportPadding in the GeoJsonViewportSource options allows you to expand the requested data area by the specified value in pixels. By default, the requested area is equal to the viewport of the screen. For example:
const lines = new mapgl.GeoJsonViewportSource(map, {
    data: WFS_LINES_DATA_FN,
    attributes: { exampleCase: 'line' },
    viewportPadding: 500,
});
To expand the requested data area of the created source, use the setViewportPadding method:
lines.setViewportPadding(1000);