GeoJSON
To show GeoJSON data on the map, you need to add:
- a source with the data to the map
- a layer to a map style to describe data appearance
Adding data source
Let's take an example of GeoJSON data:
const data = {
    type: 'FeatureCollection',
    features: [
        {
            type: 'Feature',
            properties: {},
            geometry: {
                type: 'Polygon',
                coordinates: [
                    [
                        [55.41, 25.34],
                        [55.44, 25.34],
                        [55.43, 25.37],
                        [55.41, 25.34],
                    ],
                ],
            },
        },
    ],
};
To add the data as a map data source, you need to use GeoJsonSource:
const source = new mapgl.GeoJsonSource(map, {
    data,
});
The code above adds the polygon to the map data only. But the map can't render it because it can't link to a specific map style layer. The polygon adds to the general data array of the map, where you can't distinguish one polygon from another.
To distinguish it from other polygons, you should add a unique attribute for it in properties field:
const data = {
    type: 'FeatureCollection',
    features: [
        {
            type: 'Feature',
            properties: {
                foo: 'qwe', // Unique attribute
            },
            geometry: {
                type: 'Polygon',
                coordinates: [
                    [
                        [55.41, 25.34],
                        [55.44, 25.34],
                        [55.43, 25.37],
                        [55.41, 25.34],
                    ],
                ],
            },
        },
    ],
};
Or you can add a unique attribute to the whole data source in attributes field:
const source = new mapgl.GeoJsonSource(map, {
    data,
    attributes: {
        bar: 'asd', // Unique attribute
    },
});
Now the polygon can be associated with a new map style layer and therefore drawn.
Adding style layer
A map style is a config that describes map data appearance. The style contains layers. Each layer contains:
filterfield — to describe a data filtering logic to determine which data will be drawn by this layer;stylefield — to describe the appearance of the drawing objects (color, width, font, etc.).
You can find more information about the map style in Style Specification.
Adding with API
We added a polygon as the map data source above. Now, we can link it with a new style layer.
At first, create a new layer:
const layer = {
    id: 'my-polygons-layer', // Each layer ID must be unique

    // Data filtering logic
    filter: [
        'match',
        ['sourceAttr', 'bar'],
        ['asd'],
        true, // Result if value of bar source attribute equals "asd"
        false, // Result if not
    ],

    // Drawing object type
    type: 'polygon',

    // Style of drawing object
    style: {
        color: '#0000ff',
    },
};
Here in filter we use:
SourceAttrExpression— to get values frombarsource attribute;MatchExpression— to match the values with string"asd".
If you used the GeoJSON object properties field to add the unique attribute, you should use GetExpression instead of SourceAttrExpression.
At the end, you need to add the created layer to a map style using map.addLayer(layer), and the map will be redrawn along with the new polygon:
<!DOCTYPE html>
<html lang="en">
    <head>
        <meta charset="UTF-8" />
        <meta name="viewport" content="width=device-width, initial-scale=1.0" />
        <title>2GIS Map API</title>
        <meta name="description" content="GeoJSON polygon example" />
        <style>
            html,
            body,
            #container {
                margin: 0;
                width: 100%;
                height: 100%;
                overflow: hidden;
            }
        </style>
    </head>
    <body>
        <div id="container"></div>
        <script src="https://mapgl.2gis.com/api/js/v1"></script>
        <script>
            const map = new mapgl.Map('container', {
                center: [55.425, 25.355],
                zoom: 13,
                key: 'Your API access key',
            });

            const data = {
                type: 'FeatureCollection',
                features: [
                    {
                        type: 'Feature',
                        properties: {},
                        geometry: {
                            type: 'Polygon',
                            coordinates: [
                                [
                                    [55.41, 25.34],
                                    [55.44, 25.34],
                                    [55.43, 25.37],
                                    [55.41, 25.34],
                                ],
                            ],
                        },
                    },
                ],
            };

            const source = new mapgl.GeoJsonSource(map, {
                data,
                attributes: {
                    bar: 'asd',
                },
            });

            const layer = {
                id: 'my-polygons-layer', // Each layer ID must be unique

                // Data filtering logic
                filter: [
                    'match',
                    ['sourceAttr', 'bar'],
                    ['asd'],
                    true, // Result if value of bar source attribute equals "asd"
                    false, // Result if not
                ],

                // Drawing object type
                type: 'polygon',

                // Style of drawing object
                style: {
                    color: '#0000ff',
                },
            };

            map.on('styleload', () => {
                map.addLayer(layer);
            });
        </script>
    </body>
</html>
Adding layer after style load
After creating a map, its style will be empty until it is loaded from the server. It is important to add new layers only after style loading because the loaded style will completely overwrite the old one. To do this, the example above uses styleload event, which is emitted every time after a new style is set:
map.on('styleload', () => {
    map.addLayer(layer);
});
If you change a map style with map.setStyleById() method, you can also use Promise that the method returns:
map.setStyleById('e05ac437-fcc2-4845-ad74-b1de9ce07555').then(() => {
    map.addLayer(layer);
});
Adding before another layer
Layers of a map style are ordered relative to each other. The order of the layers determines the sequence in which they are drawn on the map.
By default, the map.addLayer(layer) method adds a new layer to the end of the layers list, i.e. the new layer will be drawn last. If you need to add the layer not at the end, but before of another layer, you need to specify the ID of another layer in the method as the second argument:
map.addLayer(anotherLayer, 'my-polygons-layer');
You can also add the layer before the layers that are configured in Style editor:
map.addLayer(layer, '577315');
<!DOCTYPE html>
<html lang="en">
    <head>
        <meta charset="UTF-8" />
        <meta name="viewport" content="width=device-width, initial-scale=1.0" />
        <title>2GIS Map API</title>
        <meta name="description" content="GeoJSON polygon under roads example" />
        <style>
            html,
            body,
            #container {
                margin: 0;
                width: 100%;
                height: 100%;
                overflow: hidden;
            }
        </style>
    </head>
    <body>
        <div id="container"></div>
        <script src="https://mapgl.2gis.com/api/js/v1"></script>
        <script>
            const map = new mapgl.Map('container', {
                center: [55.425, 25.355],
                zoom: 13,
                key: 'Your API access key',
            });

            const data = {
                type: 'FeatureCollection',
                features: [
                    {
                        type: 'Feature',
                        properties: {},
                        geometry: {
                            type: 'Polygon',
                            coordinates: [
                                [
                                    [55.41, 25.34],
                                    [55.44, 25.34],
                                    [55.43, 25.37],
                                    [55.41, 25.34],
                                ],
                            ],
                        },
                    },
                ],
            };

            const source = new mapgl.GeoJsonSource(map, {
                data,
                attributes: {
                    bar: 'asd',
                },
            });

            const layer = {
                id: 'my-polygons-layer', // Each layer ID must be unique

                // Data filtering logic
                filter: [
                    'match',
                    ['sourceAttr', 'bar'],
                    ['asd'],
                    true, // Result if value of bar source attribute equals "asd"
                    false, // Result if not
                ],

                // Drawing object type
                type: 'polygon',

                // Style of drawing object
                style: {
                    color: '#0000ff',
                },
            };

            map.on('styleload', () => {
                map.addLayer(layer, '577315');
            });
        </script>
    </body>
</html>
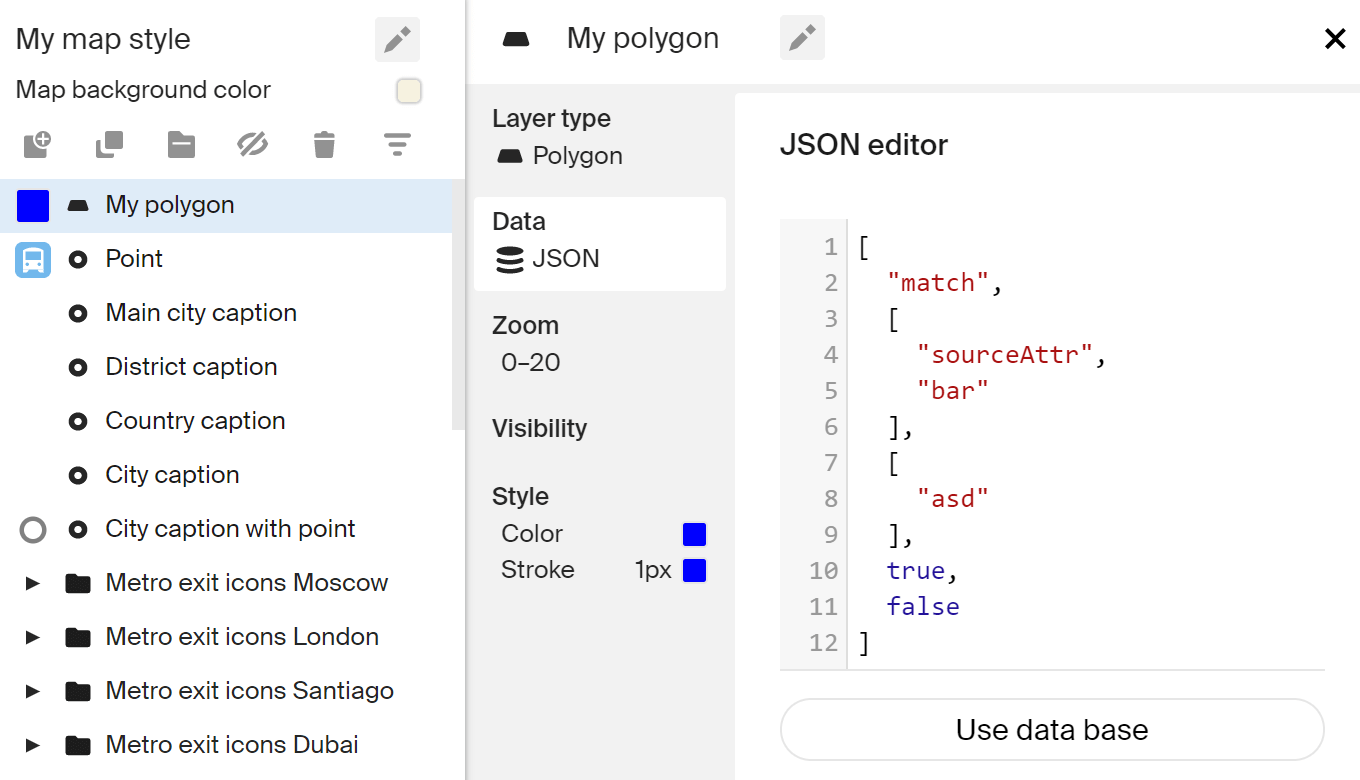
Adding with Style Editor
To draw a data source, instead of adding a layer via the API, you can also add it in Style editor to your map style.
To do this, there, at the creating new layer step, you should click JSON — manual adding button and add MatchExpression, which would have to be specified in the filter when adding a layer via API:
Events
To subscribe to events, such as a click on GeoJsonSource or to other MapEventTable events, use on() method of map instance. GeoJsonSource objects contain targetData with a type GeoJsonEventTargetData in events.
<!DOCTYPE html>
<html lang="en">

<head>
    <meta charset="UTF-8" />
    <meta name="viewport" content="width=device-width, initial-scale=1.0" />
    <title>2GIS Map API</title>
    <meta name="description" content="GeoJSON events example" />
    <style>
        html,
        body,
        #container {
            margin: 0;
            width: 100%;
            height: 100%;
            overflow: hidden;
        }
    </style>
</head>

<body>
    <div id="container"></div>
    <script src="https://mapgl.2gis.com/api/js/v1"></script>
    <script>
        const map = new mapgl.Map('container', {
            center: [55.4218, 25.3357],
            zoom: 17,
            pitch: 45,
            key: 'Your API access key',
        });

        const data = {
            type: 'FeatureCollection',
            features: [
                {
                    type: 'Feature',
                    properties: {
                        type: 'star',
                        name: 'geoJson Polygon - star-polygon A'
                    },
                    geometry: {
                        type: 'Polygon',
                        coordinates: [
                            [
                                [55.422656536102316, 25.335250625051458],
                                [55.42331099510195, 25.335570623342118],
                                [55.42392253875736, 25.33520214038817],
                                [55.423622131347685, 25.335774258177413],
                                [55.42422294616701, 25.336074861355655],
                                [55.423579216003446, 25.33610395194616],
                                [55.42338609695437, 25.336666368655063],
                                [55.42309641838077, 25.336123345669286],
                                [55.422409772872946, 25.33614273938931],
                                [55.42298913002018, 25.33580334884018],
                                [55.422656536102316, 25.335250625051458],
                            ],
                        ],
                    },
                },
                {
                    type: 'Feature',
                    properties: {
                        type: 'star',
                        name: 'geoJson Polygon - star-polygon B'
                    },
                    geometry: {
                        type: 'Polygon',
                        coordinates: [
                            [
                                [55.419437885284445, 25.334988807638815],
                                [55.42009234428408, 25.335308806621768],
                                [55.42070388793948, 25.334940322870644],
                                [55.420403480529814, 25.33551244189763],
                                [55.42100429534914, 25.335813045726233],
                                [55.42036056518557, 25.33584213637969],
                                [55.420167446136496, 25.336404554305396],
                                [55.419877767562895, 25.335861530144776],
                                [55.419191122055075, 25.335880923906757],
                                [55.419770479202306, 25.33554153262335],
                                [55.419437885284445, 25.334988807638815],
                            ],
                        ],
                    },
                },

                {
                    type: 'Feature',
                    properties: {
                        type: 'marker',
                        label: 'Star A',
                        color: 'blue',
                        name: 'geoJson Point - star-marker A'
                    },
                    geometry: {
                        type: 'Point',
                        coordinates: [55.42332172393799, 25.33587122702617],
                    },
                },
                {
                    type: 'Feature',
                    properties: {
                        type: 'marker',
                        label: 'Star B',
                        color: 'blue',
                        name: 'geoJson Point - star-marker B'
                    },
                    geometry: {
                        type: 'Point',
                        coordinates: [55.420124530792236, 25.335590017150714],
                    },
                },

            ],
        };

        const source = new mapgl.GeoJsonSource(map, {
            data,
            attributes: {
                bar: 'asd',
            },
        });

        map.on('styleload', () => {
            map.addLayer(
                {
                    type: 'polygon',
                    id: 'my-stars',
                    filter: [
                        'all',
                        ['match', ['sourceAttr', 'bar'], ['asd'], true, false],
                        ['match', ['get', 'type'], ['star'], true, false],
                    ],
                    style: {
                        color: '#fcc9ff',
                    },
                },
            );


            map.addLayer({
                type: 'point',
                id: 'my-marker',
                filter: [
                    'all',
                    ['match', ['sourceAttr', 'bar'], ['asd'], true, false],
                    ['match', ['get', 'type'], ['marker'], true, false],
                ],
                style: {
                    iconImage: ['match', ['get', 'color'], ['blue'], 'ent_i', 'ent'],
                    iconWidth: 25,
                    textField: ['get', 'label'],
                    textFont: ['Noto_Sans'],
                    textColor: '#0098ea',
                    textHaloColor: '#fff',
                    textHaloWidth: 1,
                    iconPriority: 100,
                    textPriority: 100,
                },
            });
        });
        map.on('click', (e) => { if (e.targetData.type === 'geojson') { alert('GeoJsonFeature clicked: ' + e.targetData.feature.properties.name) } })
    </script>
</body>

</html><!DOCTYPE html>
<html lang="en">
<head>
<meta charset="UTF-8" />
<meta name="viewport" content="width=device-width, initial-scale=1.0" />
<title>2GIS Map API</title>
<meta name="description" content="GeoJSON complex example" />
<style>
html,
body,
#container {
margin: 0;
width: 100%;
height: 100%;
overflow: hidden;
}
</style>
</head>
<body>
<div id="container"></div>
<script src="https://mapgl.2gis.com/api/js/v1"></script>
<script>
const map = new mapgl.Map('container', {
center: [55.4218, 25.3357],
zoom: 17,
pitch: 45,
key: 'Your API access key',
});
const data = {
type: 'FeatureCollection',
features: [
{
type: 'Feature',
properties: {
type: 'topLine',
},
geometry: {
type: 'LineString',
coordinates: [
[55.41612267494202, 25.3373063569028],
[55.418890714645386, 25.33572577372391],
[55.41969537734985, 25.336870001646474],
[55.42081117630005, 25.33621061738493],
[55.421626567840576, 25.337393627765234],
[55.42233467102051, 25.336966969617198],
[55.42382597923279, 25.339100245313542],
],
},
},
{
type: 'Feature',
properties: {
type: 'star',
},
geometry: {
type: 'Polygon',
coordinates: [
[
[55.422656536102316, 25.335250625051458],
[55.42331099510195, 25.335570623342118],
[55.42392253875736, 25.33520214038817],
[55.423622131347685, 25.335774258177413],
[55.42422294616701, 25.336074861355655],
[55.423579216003446, 25.33610395194616],
[55.42338609695437, 25.336666368655063],
[55.42309641838077, 25.336123345669286],
[55.422409772872946, 25.33614273938931],
[55.42298913002018, 25.33580334884018],
[55.422656536102316, 25.335250625051458],
],
],
},
},
{
type: 'Feature',
properties: {
type: 'star',
},
geometry: {
type: 'Polygon',
coordinates: [
[
[55.419437885284445, 25.334988807638815],
[55.42009234428408, 25.335308806621768],
[55.42070388793948, 25.334940322870644],
[55.420403480529814, 25.33551244189763],
[55.42100429534914, 25.335813045726233],
[55.42036056518557, 25.33584213637969],
[55.420167446136496, 25.336404554305396],
[55.419877767562895, 25.335861530144776],
[55.419191122055075, 25.335880923906757],
[55.419770479202306, 25.33554153262335],
[55.419437885284445, 25.334988807638815],
],
],
},
},
{
type: 'Feature',
properties: {
type: 'bottomLine',
},
geometry: {
type: 'LineString',
coordinates: [
[55.42360067367554, 25.33460092894936],
[55.42147636413574, 25.335803348840205],
[55.42107939720153, 25.335231231188487],
[55.42302131652832, 25.334077290746556],
],
},
},
{
type: 'Feature',
properties: {
type: 'marker',
label: 'Star #2',
color: 'blue',
},
geometry: {
type: 'Point',
coordinates: [55.42332172393799, 25.33587122702617],
},
},
{
type: 'Feature',
properties: {
type: 'marker',
label: 'Star #1',
color: 'blue',
},
geometry: {
type: 'Point',
coordinates: [55.420124530792236, 25.335590017150714],
},
},
{
type: 'Feature',
properties: {
type: 'marker',
color: 'gray',
},
geometry: {
type: 'Point',
coordinates: [55.4215407371521, 25.336588794091984],
},
},
{
type: 'Feature',
properties: {
type: 'marker',
color: 'gray',
},
geometry: {
type: 'Point',
coordinates: [55.42234539985657, 25.33490153504211],
},
},
],
};
const source = new mapgl.GeoJsonSource(map, {
data,
attributes: {
bar: 'asd',
},
});
map.on('styleload', () => {
map.addLayer(
{
type: 'polygon',
id: 'my-stars',
filter: [
'all',
['match', ['sourceAttr', 'bar'], ['asd'], true, false],
['match', ['get', 'type'], ['star'], true, false],
],
style: {
color: '#fcc9ff',
},
},
'31871',
);
map.addLayer(
{
type: 'dashedLine',
id: 'my-dashedline',
filter: [
'all',
['match', ['sourceAttr', 'bar'], ['asd'], true, false],
['match', ['get', 'type'], ['topLine'], true, false],
],
style: {
color: '#0baf08',
width: 10,
dashLength: 10,
gapLength: 5,
},
},
'595890',
);
map.addLayer(
{
type: 'line',
id: 'my-line',
filter: [
'all',
['match', ['sourceAttr', 'bar'], ['asd'], true, false],
['match', ['get', 'type'], ['bottomLine'], true, false],
],
style: {
color: '#ffcd17',
width: 7,
},
},
'595890',
);
map.addLayer({
type: 'point',
id: 'my-marker',
filter: [
'all',
['match', ['sourceAttr', 'bar'], ['asd'], true, false],
['match', ['get', 'type'], ['marker'], true, false],
],
style: {
iconImage: ['match', ['get', 'color'], ['blue'], 'ent_i', 'ent'],
iconWidth: 25,
textField: ['get', 'label'],
textFont: ['Noto_Sans'],
textColor: '#0098ea',
textHaloColor: '#fff',
textHaloWidth: 1,
iconPriority: 100,
textPriority: 100,
},
});
});
</script>
</body>
</html>