Creating a scene
Scene is a set of layers and widgets that describe a specific data analytics scenario. Within a scene, you can configure data visualization for layers and add widgets: with charts based on layer data, with text, and with indicators. For each scene, you can customize the map style, specify geofilters, and set the camera position.
You can create scenes within a dashboard.
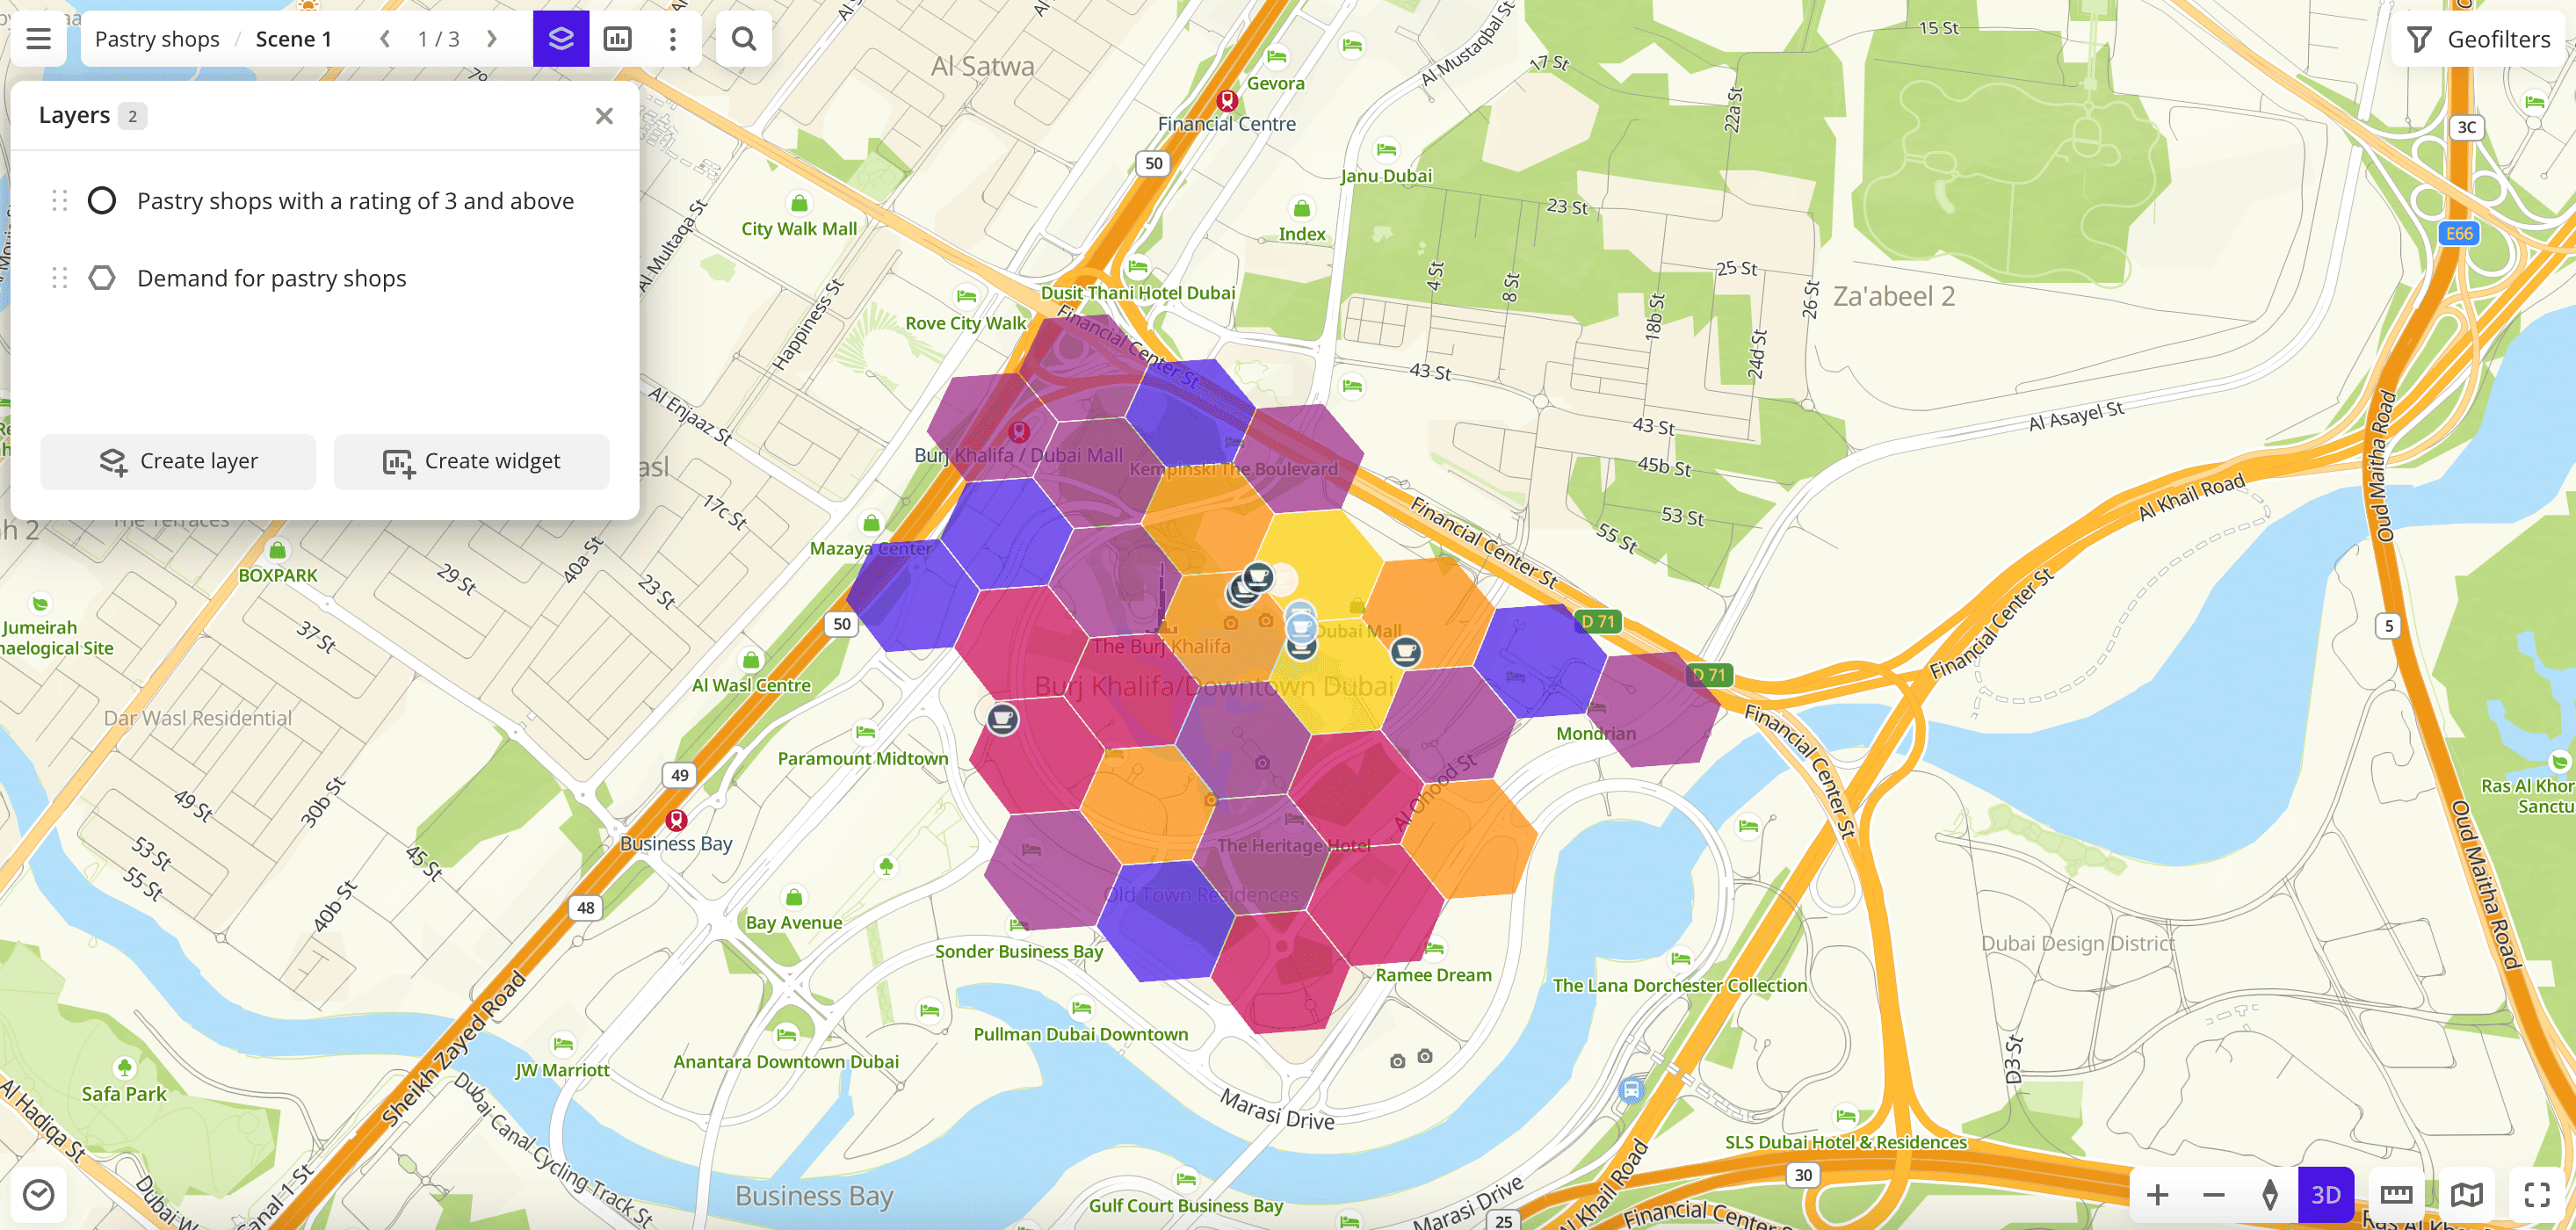
Dashboard scene example:
If you use the demo tariff plan, you can create no more than two scenes within one dashboard.
Creating a scene
- When working with a dashboard
- When working with data
- Go to the Dashboards tab and open the dashboard.
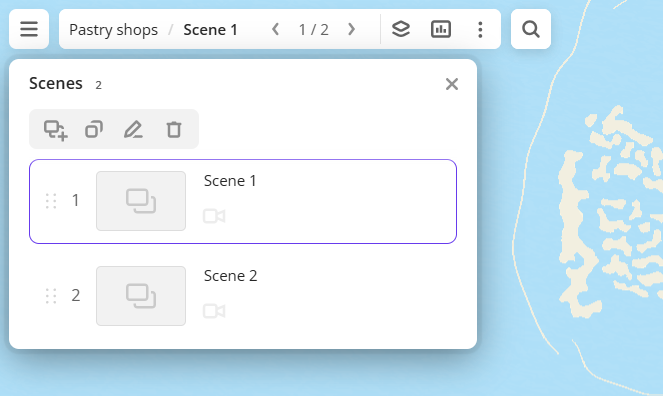
- In the top menu of the dashboard, click
 icon and select Scenes.
 - In the Scenes dialog, click
 icon.
icon.
After that, you can create layers within the scene to work with data.
-
Go to the Main or Data tab.
-
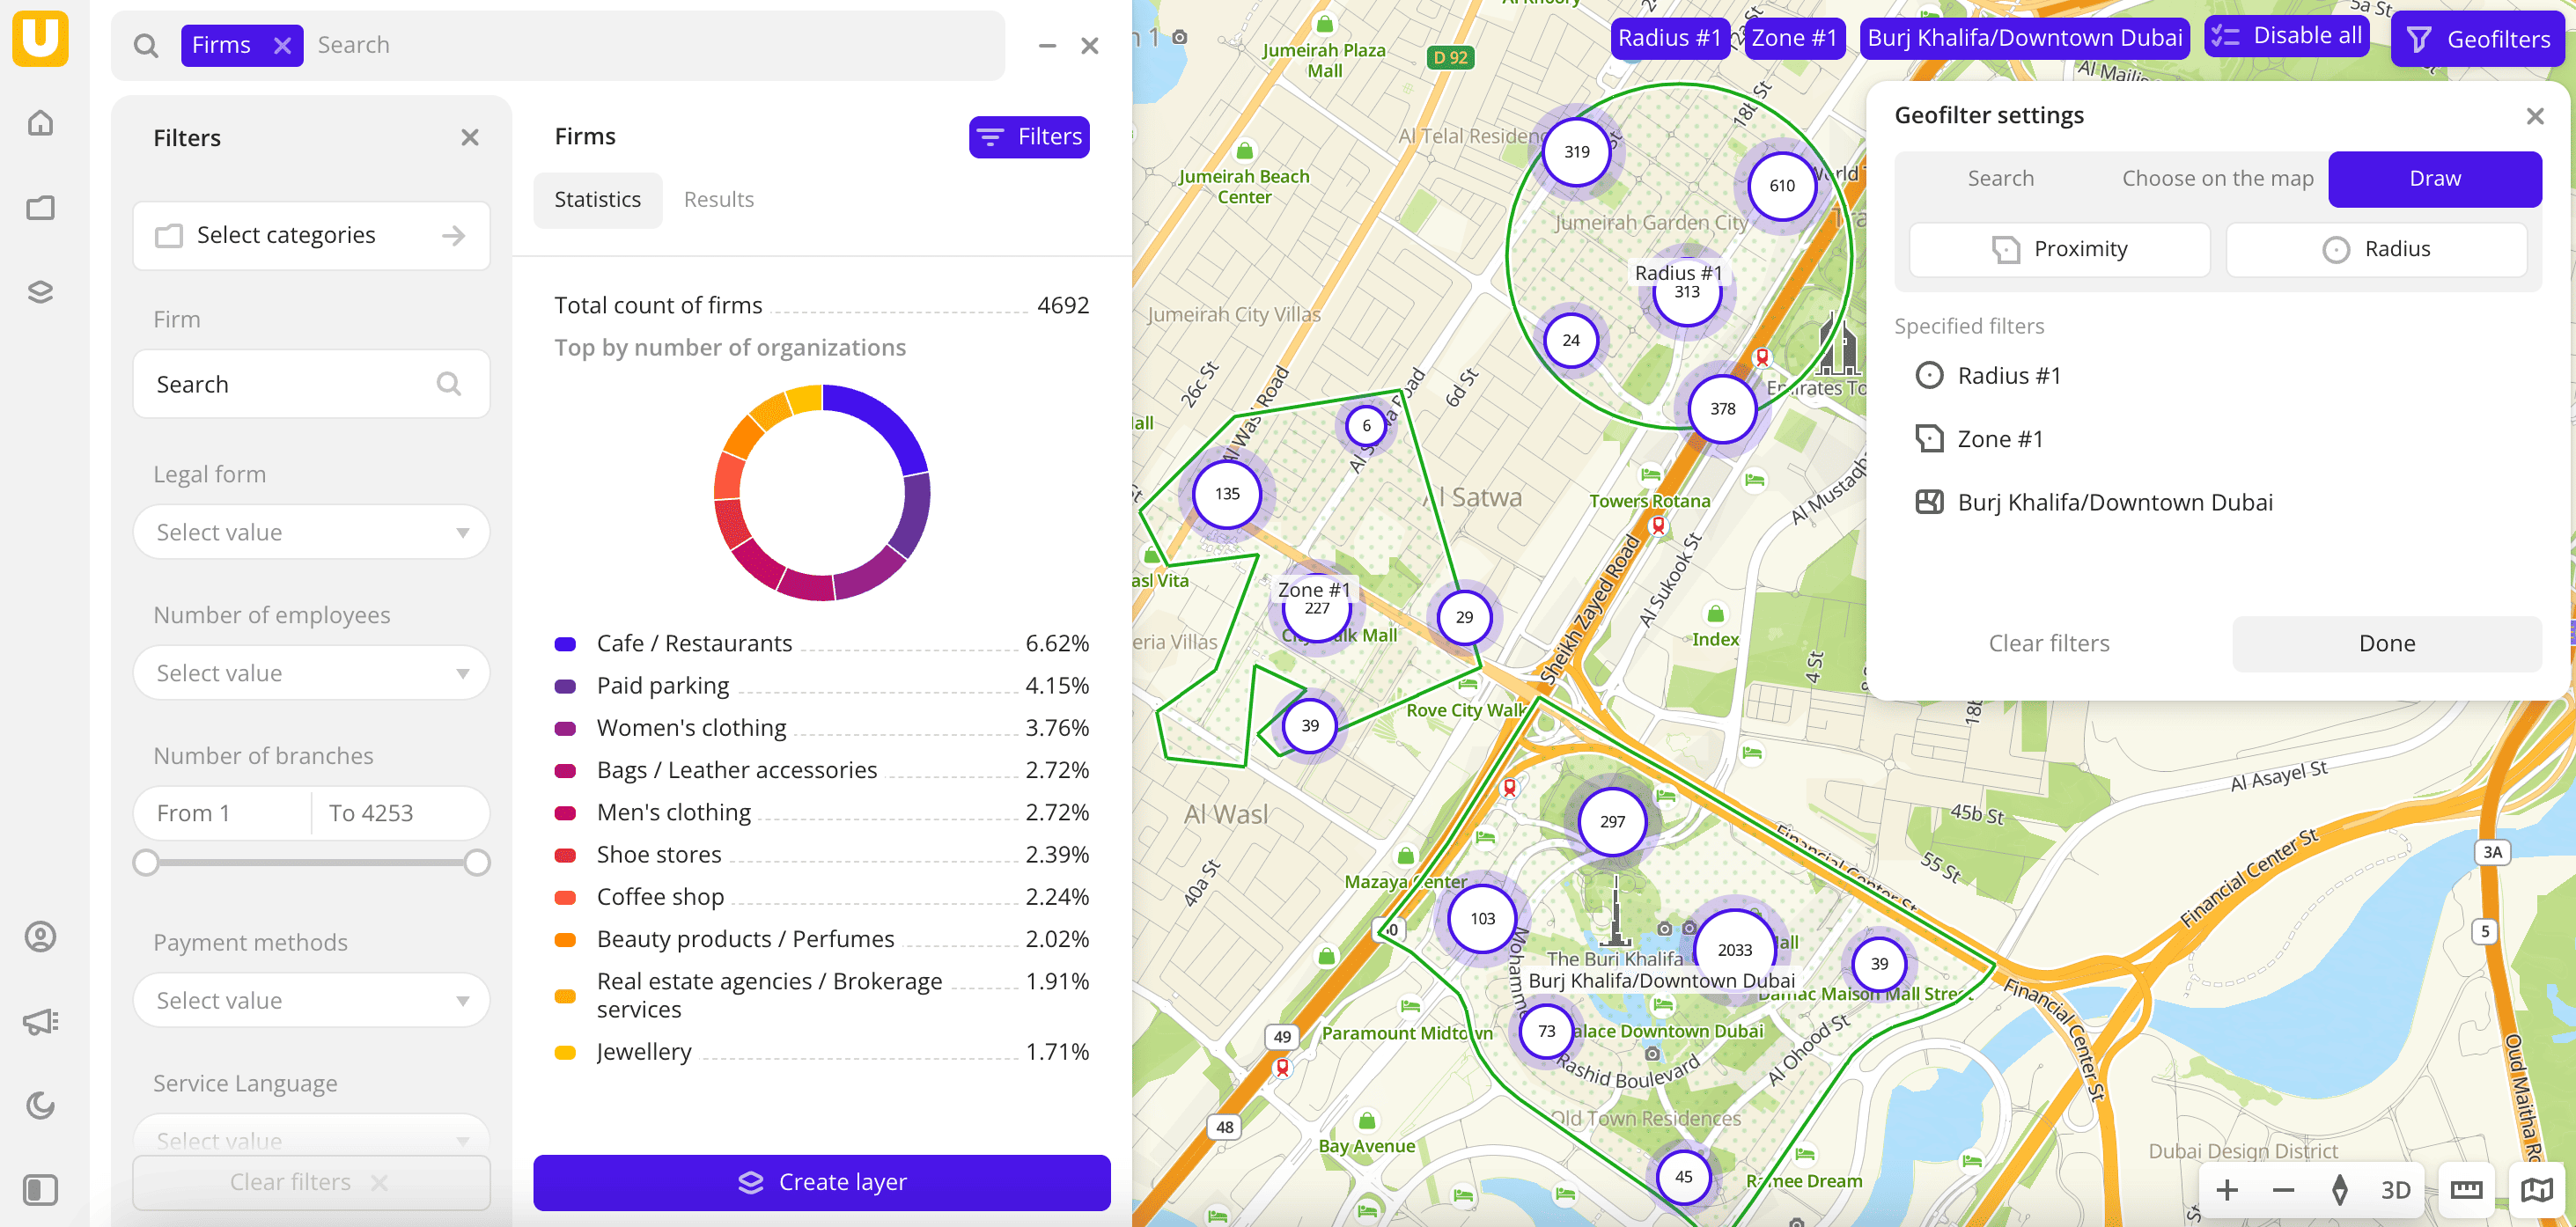
Select the built-in or the uploaded dataset.
-
In the Geofilter settings dialog, select up to 50 territories for which the data sample is created. You can use standard and custom territories and also build polygons, proximity zones, and circles on the map. For more information, see the Geofilters section. After you select the territories, click Done.
-
If you selected the built-in dataset Pedestrian traffic or uploaded data with line or polygon geometries, you can select the data display method at the top of the Filters tab:
- Points: display as centroid points (the centers of the object geometries).
- Geometries: display as real data geometries (lines or polygons).
-
On the Filters tab, set the remaining filters if necessary.
-
Click Create layer.
If there are no created dashboards, a dashboard with one scene is created, and the layer with data is automatically added to the scene.
-
If there is at least one dashboard created, specify where to add the layer in the dialog:
- Select an existing dashboard and scene in the list to add the layer. Click Create.
- Click New dashboard, enter a name of the new dashboard, and click Create. A new dashboard with one scene is created, and the layer with data is automatically added to the scene.
What's next?
- See available Operations with scenes.
- Getting started.
- Get to know how to work with Data and Data visualization.
- Learn more about Layers, Dashboards, and Widgets.
- Learn about ready-made Analytics scenarios.